By Roland Luethy and Ljubomir Buturovic, Inflammatix, Inc.
Introduction
Typically, a clinical classifier generates a score that corresponds to likelihood of disease presence or future outcome. In order to facilitate decision-making, the score is sometimes converted to a discrete classification label using decision thresholds [1]. For binary classification, there is a single threshold that can be chosen using a trade-off between sensitivity and specificity based on a receiver operating characteristic (ROC) curve or similar. However, it is often desirable to partition the range of output scores into multiple bands, corresponding to different likelihoods of the disease/outcome, which in turn requires multiple thresholds that cannot be determined by the inspection of ROC curves. To our knowledge, no effective solution to this problem has been described.
Here, we developed a genetic optimization algorithm for the determination of decision thresholds for multiple output bands, called Genetic Algorithm Thresholds (GAT) (the term “genetic” applies to an optimization method, not genome). We have applied this method to a three-class classifier which diagnoses the presence and type of infection in patients suspected of an acute infection and/or sepsis. The classifier uses the gene expression profile of patients’ immune response as input features and produces scores for a patient sample indicating the probability of bacterial infection, probability of viral infection and probability of no infection.
Methods
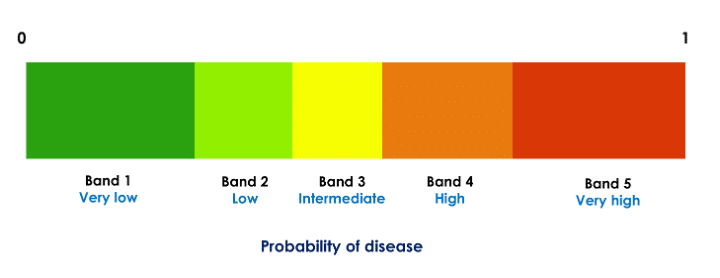
To improve interpretability and guide treatment actions, each probability (score) is partitioned to likelihood bands such that each probability range [0, 1] is divided into five disjoint decision intervals (Fig. 1). Thus, in our application, each of the three probabilities of disease (bacterial, viral, and no infection) is divided into five bands. For example, if a given patient’s scores are in the very likely band for the viral infection (very high probability of viral infection) and very unlikely band for bacterial infection (very low probability of bacterial infection), treatment with antibiotics may not be beneficial.
Figure 1: Partitioning of a classifier probability in five decision bands. Each of the three class probabilities computed by the classifier is partitioned into five such bands. The thresholds are specific to the probabilities and are computed independently for each class.
The decision thresholds, which define the bands, should be chosen using clinically meaningful criteria. For example, we could specify that both the confidence in and the number of patients assigned to the “extreme” bands (lowest or highest probability band) should be as high as possible because those are the clinically most actionable bands. We represent stringency for each band using diagnostic likelihood ratios (LR) [2]. For example, for the bacterial and viral scores the clinical considerations (obtained through input from clinician community) suggest LR for the lowest band should be at most 0.075 and for the highest band at least 7.5. Furthermore, for the test to demonstrate utility at a population level, a meaningful percentage of patients should fall in the extreme bands and few patients should result in the non-informative middle (indeterminate) band (e.g., at least 50% patients should be in the extreme bands and at most 10% in the middle band). To balance these requirements and to find thresholds that generate bands (decision thresholds) meeting them, we developed a tool using a genetic algorithm with a cost function encapsulating the desired criteria.
Dataset Overview
The training set for the classifier consists of 29 genes (input features) profiled in 3159 patients from 42 clinical studies, assayed on gene expression microarrays. The validation set comprises 741 samples from 9 independent clinical studies, using the same 29 input features measured on the Nanostring nCounter(R) platform [3]. To ensure consistency and accuracy, both the training and validation sets were normalized using samples from healthy patients, with the Nanostring platform serving as a reference. The classifier is an advanced version of a previously published one [4].
Algorithm Overview
We implemented the Genetic Algorithm Thresholds (GAT) algorithm, shown below, in python using the DEAP library [5, 6]. We apply the steps 1 through 4 independently to each output class (i.e., set of bacterial, viral, and non-infected probabilities) to optimize the corresponding decision thresholds. At the completion of the analysis, 12 thresholds are generated (4 for each class).
The initial population for the evolutionary (genetic) algorithm is randomly generated. A set of ‘chromosomes,’ each representing a potential solution to the problem, is created (the term “chromosome” applies to a vector representing a set of thresholds, not a DNA fiber in cell nucleus). The chromosome corresponding to a solution has four values, representing the 4 thresholds needed to split the probabilities into 5 bands.
The fitness of each chromosome in the population is evaluated using a fitness function. The function assigns a fitness score to each chromosome based on how well it fits the desired criteria for LR1, LR5, percentage of patients in band 1 and band 5 combined (coverage) and percentage of patients in band 3. The coverage is only considered if the value is below the target value, so that coverage exceeding the target is not penalized.
A new generation is created by selecting parents according to their fitness. Offspring are created using crossover and mutation operations. The individuals with the top 20% fitness are always kept in the population.
Steps 2 and 3 are repeated for a given number of iterations until there is no improvement of the best solution.
Results
We trained the classifier on the training set and applied the tuned classifier to the validation set. Then we applied GAT to the validation set probabilities. The results are summarized in Table 1. It shows the target values that were used for GAT and the actual values with the best thresholds found by GAT for the bacterial and viral probabilities.
Target value
Achieved value (bacterial)
Achieved value (viral)
LR1 (lowest band)
0.075
0.089
0.101
LR5 (highest band)
7.5
8.688
9.678
% in band 1 and 5
50
69.8
69.1
% in band 3
7.5
8.6
10
Table 1: Target values and achieved values for the three-class infectious disease classifier. GAT does not guarantee that all target values will be achieved. Nevertheless, overall performance was deemed adequate.
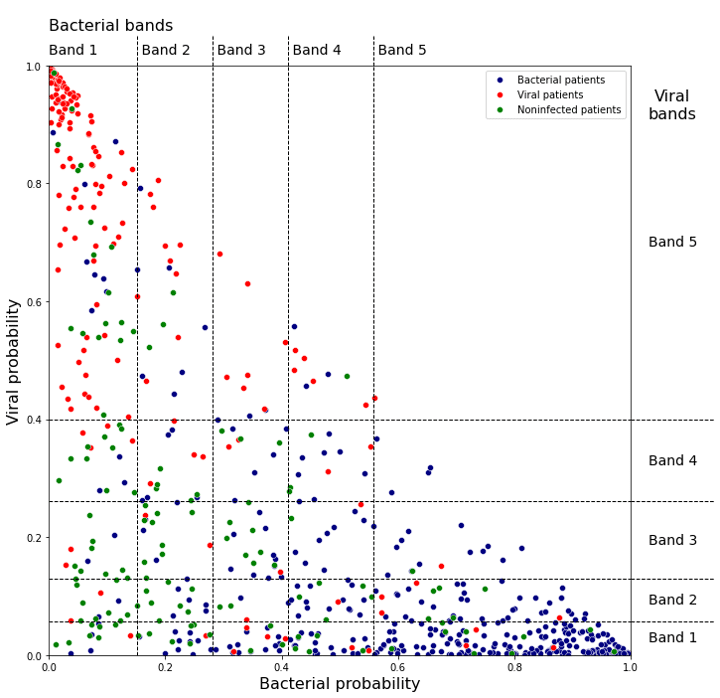
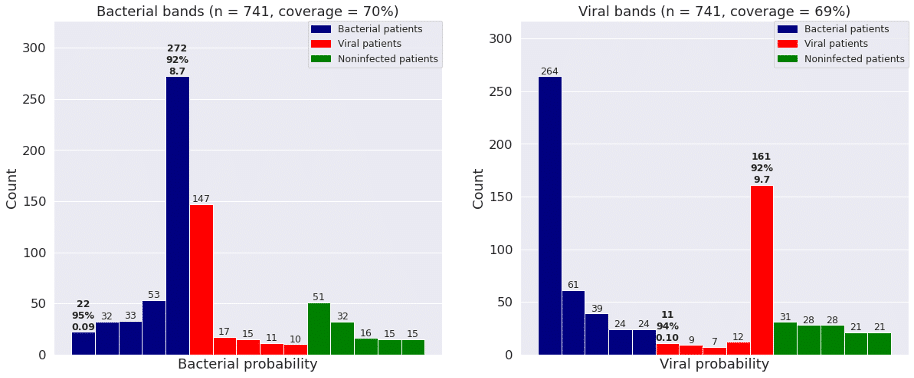
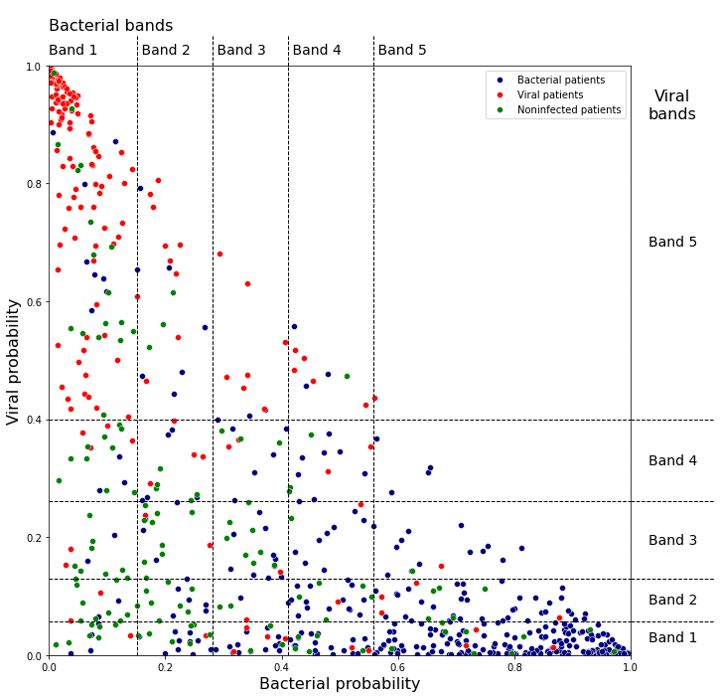
Figure 2 shows the bacterial and viral probabilities and the thresholds for the classifier, where blue and red dots represent patients with bacterial or viral infection, respectively. The green dots represent patients with inflammation that are not caused by bacterial nor viral infections. The dotted lines represent the thresholds determined using GAT. The thresholds let us assign each sample to one of five bacterial and five viral likelihood bands. Samples that fall in bacterial band 1 are very unlikely to be bacterial infections, whereas samples in bacterial band 5 are very likely bacterial infections. Similarly, samples that fall in viral band 1 are very unlikely to be viral infections, whereas samples in viral band 5 are very likely viral infections. Figure 3 shows that most patients with bacterial infections are in bacterial band 5 and viral band 1 and most patients with viral infections are in bacterial band 1 and viral band 5.
Figure 2: Assignment of bacterial and viral probabilities to likelihood bands. The dotted lines are the thresholds determined using GAT.
Figure 3: Frequency of patients with bacterial infections, viral infections, and no infections in each of the five bacterial and viral bands defined by GAT. “Coverage” is percent of patients in bands 1 and 5.
Conclusion
We found that GAT enables efficient optimization of decision thresholds using an arbitrary number of decision regions (bands) and an arbitrary fitness function. We intend to use this method to define decision thresholds for the TriVerityTM Acute Infection and Sepsis Test, currently in development at Inflammatix.
References
https://www.canassistbreast.com/sample-report.php
Hayden SR, Brown MD. Likelihood ratio: a powerful tool for incorporating the results of a diagnostic test into clinical decision making. Annals of emergency medicine. 1999 May 1;33(5):575-80.
Kulkarni MM. Digital multiplexed gene expression analysis using the NanoString nCounter system. Current protocols in molecular biology. 2011 Apr;94(1):25B-10.
Mayhew MB, Buturovic L, Luethy R, Midic U, Moore AR, Roque JA, Shaller BD, Asuni T, Rawling D, Remmel M, Choi K. A generalizable 29-mRNA neural-network classifier for acute bacterial and viral infections. Nature communications. 2020 Mar 4;11(1):1177.
Fortin FA, De Rainville FM, Gardner MA, Parizeau M, Gagné C. DEAP: Evolutionary algorithms made easy. The Journal of Machine Learning Research. 2012 Jul 1;13(1):2171-5.
Wirsansky E. Hands-on genetic algorithms with Python: applying genetic algorithms to solve real-world deep learning and artificial intelligence problems. Packt Publishing Ltd; 2020 Jan 31.
By Roland Luethy and Ljubomir Buturovic, Inflammatix, Inc.
Introduction
Typically, a clinical classifier generates a score that corresponds to likelihood of disease presence or future outcome. In order to facilitate decision-making, the score is sometimes converted to a discrete classification label using decision thresholds [1]. For binary classification, there is a single threshold that can be chosen using a trade-off between sensitivity and specificity based on a receiver operating characteristic (ROC) curve or similar. However, it is often desirable to partition the range of output scores into multiple bands, corresponding to different likelihoods of the disease/outcome, which in turn requires multiple thresholds that cannot be determined by the inspection of ROC curves. To our knowledge, no effective solution to this problem has been described.
Here, we developed a genetic optimization algorithm for the determination of decision thresholds for multiple output bands, called Genetic Algorithm Thresholds (GAT) (the term “genetic” applies to an optimization method, not genome). We have applied this method to a three-class classifier which diagnoses the presence and type of infection in patients suspected of an acute infection and/or sepsis. The classifier uses the gene expression profile of patients’ immune response as input features and produces scores for a patient sample indicating the probability of bacterial infection, probability of viral infection and probability of no infection.
Methods
To improve interpretability and guide treatment actions, each probability (score) is partitioned to likelihood bands such that each probability range [0, 1] is divided into five disjoint decision intervals (Fig. 1). Thus, in our application, each of the three probabilities of disease (bacterial, viral, and no infection) is divided into five bands. For example, if a given patient’s scores are in the very likely band for the viral infection (very high probability of viral infection) and very unlikely band for bacterial infection (very low probability of bacterial infection), treatment with antibiotics may not be beneficial.
Figure 1: Partitioning of a classifier probability in five decision bands. Each of the three class probabilities computed by the classifier is partitioned into five such bands. The thresholds are specific to the probabilities and are computed independently for each class.
The decision thresholds, which define the bands, should be chosen using clinically meaningful criteria. For example, we could specify that both the confidence in and the number of patients assigned to the “extreme” bands (lowest or highest probability band) should be as high as possible because those are the clinically most actionable bands. We represent stringency for each band using diagnostic likelihood ratios (LR) [2]. For example, for the bacterial and viral scores the clinical considerations (obtained through input from clinician community) suggest LR for the lowest band should be at most 0.075 and for the highest band at least 7.5. Furthermore, for the test to demonstrate utility at a population level, a meaningful percentage of patients should fall in the extreme bands and few patients should result in the non-informative middle (indeterminate) band (e.g., at least 50% patients should be in the extreme bands and at most 10% in the middle band). To balance these requirements and to find thresholds that generate bands (decision thresholds) meeting them, we developed a tool using a genetic algorithm with a cost function encapsulating the desired criteria.
Dataset Overview
The training set for the classifier consists of 29 genes (input features) profiled in 3159 patients from 42 clinical studies, assayed on gene expression microarrays. The validation set comprises 741 samples from 9 independent clinical studies, using the same 29 input features measured on the Nanostring nCounter(R) platform [3]. To ensure consistency and accuracy, both the training and validation sets were normalized using samples from healthy patients, with the Nanostring platform serving as a reference. The classifier is an advanced version of a previously published one [4].
Algorithm Overview
We implemented the Genetic Algorithm Thresholds (GAT) algorithm, shown below, in python using the DEAP library [5, 6]. We apply the steps 1 through 4 independently to each output class (i.e., set of bacterial, viral, and non-infected probabilities) to optimize the corresponding decision thresholds. At the completion of the analysis, 12 thresholds are generated (4 for each class).
The initial population for the evolutionary (genetic) algorithm is randomly generated. A set of ‘chromosomes,’ each representing a potential solution to the problem, is created (the term “chromosome” applies to a vector representing a set of thresholds, not a DNA fiber in cell nucleus). The chromosome corresponding to a solution has four values, representing the 4 thresholds needed to split the probabilities into 5 bands.
The fitness of each chromosome in the population is evaluated using a fitness function. The function assigns a fitness score to each chromosome based on how well it fits the desired criteria for LR1, LR5, percentage of patients in band 1 and band 5 combined (coverage) and percentage of patients in band 3. The coverage is only considered if the value is below the target value, so that coverage exceeding the target is not penalized.
A new generation is created by selecting parents according to their fitness. Offspring are created using crossover and mutation operations. The individuals with the top 20% fitness are always kept in the population.
Steps 2 and 3 are repeated for a given number of iterations until there is no improvement of the best solution.
Results
We trained the classifier on the training set and applied the tuned classifier to the validation set. Then we applied GAT to the validation set probabilities. The results are summarized in Table 1. It shows the target values that were used for GAT and the actual values with the best thresholds found by GAT for the bacterial and viral probabilities.
Target value
Achieved value (bacterial)
Achieved value (viral)
LR1 (lowest band)
0.075
0.089
0.101
LR5 (highest band)
7.5
8.688
9.678
% in band 1 and 5
50
69.8
69.1
% in band 3
7.5
8.6
10
Table 1: Target values and achieved values for the three-class infectious disease classifier. GAT does not guarantee that all target values will be achieved. Nevertheless, overall performance was deemed adequate.
Figure 2 shows the bacterial and viral probabilities and the thresholds for the classifier, where blue and red dots represent patients with bacterial or viral infection, respectively. The green dots represent patients with inflammation that are not caused by bacterial nor viral infections. The dotted lines represent the thresholds determined using GAT. The thresholds let us assign each sample to one of five bacterial and five viral likelihood bands. Samples that fall in bacterial band 1 are very unlikely to be bacterial infections, whereas samples in bacterial band 5 are very likely bacterial infections. Similarly, samples that fall in viral band 1 are very unlikely to be viral infections, whereas samples in viral band 5 are very likely viral infections. Figure 3 shows that most patients with bacterial infections are in bacterial band 5 and viral band 1 and most patients with viral infections are in bacterial band 1 and viral band 5.
Figure 2: Assignment of bacterial and viral probabilities to likelihood bands. The dotted lines are the thresholds determined using GAT.
Figure 3: Frequency of patients with bacterial infections, viral infections, and no infections in each of the five bacterial and viral bands defined by GAT. “Coverage” is percent of patients in bands 1 and 5.
Conclusion
We found that GAT enables efficient optimization of decision thresholds using an arbitrary number of decision regions (bands) and an arbitrary fitness function. We intend to use this method to define decision thresholds for the TriVerityTM Acute Infection and Sepsis Test, currently in development at Inflammatix.
References
https://www.canassistbreast.com/sample-report.php
Hayden SR, Brown MD. Likelihood ratio: a powerful tool for incorporating the results of a diagnostic test into clinical decision making. Annals of emergency medicine. 1999 May 1;33(5):575-80.
Kulkarni MM. Digital multiplexed gene expression analysis using the NanoString nCounter system. Current protocols in molecular biology. 2011 Apr;94(1):25B-10.
Mayhew MB, Buturovic L, Luethy R, Midic U, Moore AR, Roque JA, Shaller BD, Asuni T, Rawling D, Remmel M, Choi K. A generalizable 29-mRNA neural-network classifier for acute bacterial and viral infections. Nature communications. 2020 Mar 4;11(1):1177.
Fortin FA, De Rainville FM, Gardner MA, Parizeau M, Gagné C. DEAP: Evolutionary algorithms made easy. The Journal of Machine Learning Research. 2012 Jul 1;13(1):2171-5.
Wirsansky E. Hands-on genetic algorithms with Python: applying genetic algorithms to solve real-world deep learning and artificial intelligence problems. Packt Publishing Ltd; 2020 Jan 31.
By Nandita Damaraju, Ljubomir Buturovic, Inflammatix, Inc.
Are neural networks better than other machine learning algorithms on small tabular data?
Introduction
Deep Neural Networks (DNN) models outperform conventional machine learning algorithms on unstructured data modalities such as images, text, and audio. However, their application to modeling structured tabular data has not been as successful. Tabular Datasets are used in a variety of domains including medicine, finance, manufacturing, climate science. Many applications (for example, medicine) also use tabular datasets that are smaller (< 10 K samples) because samples are expensive to acquire. Given the wide use of such datasets, it would be beneficial to know which ML algorithms perform best when applied to small tabular data. Recent studies to that end (Gorishniy, 2021; Gorishniy, 2022) have been inconclusive because
In this study, we carried out an experimental comparison across different algorithms that include neural network-based algorithms against non-neural network machine learning algorithms on such tabular data.
Methodology
Dataset Overview
There are many standard data sets to compare new deep learning architectures against existing baselines such as MNIST, CIFAR, and ImageNet for image classification. In contrast, there are no established standard tabular data sets. This is addressed partly by the Penn Machine Learning Benchmark (Olson, 2017), that provides the largest collection of diverse, public benchmark datasets for evaluating new machine learning methods. The database includes many modalities of data, including tabular datasets. In this study, we used a combination of PMLB datasets and internal Inflammatix datasets. We focused on numeric features and classification problems because we have the most expertise working with such data. All the datasets used for this analysis are outlined in Table 1.
We used 6 datasets from the PMLB database. The criteria were as follows:
fewer than 10,000 samples
either binary or three-class multiclass classification tasks
the number of samples corresponding to the least common class label was above 2% of the total dataset.
Only the numerical features corresponding to these datasets were used for further analyses.
In addition to the 6 datasets above, we also use 5 datasets generated internally at Inflammatix. These datasets are also tabular and use gene expression values as features. We use gene expression data to build classifiers to diagnose various infectious diseases. In this context, each input sample (vector) represents one person (patient), features correspond to genes, and the classes correspond to different diseases or disease states. Each feature value is a measurement of the abundance of the corresponding gene in each tissue type (e.g., blood sample), using a suitable measurement platform such as qPCR. The task is to classify the patient’s disease accurately using the gene measurements as input features.
dataset
#features
#classes
#samples
class 0
class 1
class 2
ext_ann_thyroid
21
3
7200
92.6%
2.3%
5.1%
ext_appendicitis
7
2
106
80.2%
19.8%
–
ext_clean2
166
2
6598
84.6%
15.4%
–
ext_phoneme
5
2
5404
70.7%
29.3%
–
ext_schizo
11
3
340
22.9%
58.8%
18.2%
ext_spectf
44
2
349
27.2%
72.8%
–
int_BVN
29
3
3159
32.5%
33.2%
34.3%
int_COV
6
2
705
96.7%
3.3%
–
int_SEV
29
2
2622
94.6%
5.4%
–
int_TNF
7
2
136
47.8%
52.2%
–
int_VIB
7
2
1123
40.4%
59.6%
–
Table 1: Overview of datasets used
Algorithm Overview
We compared the performance of 7 different learning algorithms on these datasets as summarized in Table 2. We include three learning algorithms based on decision trees, XGBoost, LightGBM and Random Forest. We focused on the comparison of these tree-based classifiers with neural network classifiers MLP (Multi-Layer Perceptron) and TabNet (Arık, 2021). We also included Logistic Regression and Support Vector Machine algorithms as benchmarks.
Algorithm
Overview
Abbr.
LightGBM
Distributed gradient boosting framework using decision trees
LGBM
Logistic Regression
Linear method for classification, often a good benchmark
Deep Learning framework based on sequential attention
TabNet
XGBoost
Gradient boosting framework that uses tree-based methods
XGB
Table 2: Overview of learning algorithms used. Algorithms that use neural networks are highlighted in bold
Evaluating Models
We evaluated the methods using Area Under Receiver Operating Characteristic curve (AUROC) and balanced accuracy as the scoring metrics (Provost, 2003). AUROC is a metric to measure the degree of separability of different classes, for a given classifier. While it is traditionally defined for binary classification, a macro-average of the one-vs-one AUROC values was used for multiclass problems (Hand and Till, 2000). Balanced Accuracy is the arithmetic mean of sensitivity and specificity. It is used for both binary and multiclass classification with imbalanced classes. Since the datasets have a class imbalance, balanced accuracy was preferred over accuracy.
For each ML (Machine Learning) method, we first scaled the features of the datasets and then performed a comprehensive hyperparameter search of each of the ML method’s parameters using random 5-fold cross-validation to find the best parameters (according to AUROC) for each ML method on each data set.
Comparing model performance
Performance Overview
To compare the performance for each method in Table 2, the AUROC and Balanced Accuracy were computed for each algorithm and tabulated in Table 3 and 4. The corresponding 95% Confidence Intervals are also indicated. We ignored TabNet for all further analysis because of the increased run time and inferior performance.
Dataset
LGBM
LOGR
MLP
RBF
RF
XGB
ext_ann_thyroid
1.0 (1.0,1.0)
0.994 (0.991,0.995)
0.988 (0.982,0.994)
0.986 (0.981,0.99)
0.999 (0.998,1.0)
1.0 (1.0,1.0)
ext_appendicitis
0.861 (0.744,0.963)
0.861 (0.687,0.96)
0.873 (0.774,0.956)
0.864 (0.709,0.963)
0.833 (0.692,0.961)
0.854 (0.698,0.974)
ext_clean2
1.0 (1.0,1.0)
0.979 (0.975,0.983)
0.999 (0.999,1.0)
1.0 (0.999,1.0)
0.995 (0.993,0.996)
0.999 (0.999,1.0)
ext_phoneme
0.949 (0.942,0.955)
0.814 (0.802,0.829)
0.93 (0.922,0.938)
0.939 (0.93,0.947)
0.929 (0.919,0.935)
0.955 (0.948,0.962)
ext_schizo
0.629 (0.568,0.691)
0.648 (0.591,0.706)
0.648 (0.596,0.719)
0.644 (0.598,0.693)
0.591 (0.547,0.643)
0.628 (0.565,0.684)
ext_spectf
0.948 (0.919,0.975)
0.895 (0.851,0.946)
0.954 (0.927,0.982)
0.938 (0.887,0.982)
0.951 (0.92,0.977)
0.939 (0.9,0.966)
int_BVN
0.945 (0.938,0.953)
0.905 (0.893,0.914)
0.95 (0.942,0.957)
0.953 (0.944,0.96)
0.942 (0.932,0.952)
0.948 (0.94,0.956)
int_coverity
0.902 (0.81,0.956)
0.903 (0.87,0.945)
0.903 (0.822,0.954)
0.871 (0.728,0.95)
0.869 (0.804,0.936)
0.905 (0.834,0.966)
int_severity
0.915 (0.888,0.933)
0.922 (0.891,0.938)
0.93 (0.911,0.951)
0.902 (0.876,0.929)
0.905 (0.873,0.932)
0.924 (0.901,0.94)
int_tnfa
0.816 (0.716,0.904)
0.787 (0.686,0.877)
0.812 (0.683,0.909)
0.815 (0.736,0.901)
0.786 (0.675,0.892)
0.797 (0.688,0.868)
int_virabac
0.942 (0.916,0.958)
0.941 (0.915,0.954)
0.949 (0.929,0.962)
0.945 (0.921,0.961)
0.941 (0.919,0.956)
0.943 (0.919,0.959)
Table 3: Area Under the Curve (AUROC) performance. The best result for each dataset is highlighted in bold
A cursory analysis of the AUROC results (Table 3) indicates that MLP is the top performer. Since many AUROC values are high, we also looked at balanced accuracy scores. The balanced accuracy values reveal a similar picture: MLP still seems to outperform the other methods (Table 4).
Dataset
LGBM
LOGR
MLP
RBF
RF
XGB
ext_ann_thyroid
0.992 (0.978,0.999)
0.961 (0.946,0.971)
0.887 (0.852,0.914)
0.849 (0.827,0.886)
0.99 (0.982,0.995)
0.992 (0.983,0.998)
ext_appendicitis
0.762 (0.644,0.899)
0.775 (0.592,0.911)
0.715 (0.596,0.863)
0.786 (0.639,0.932)
0.762 (0.644,0.899)
0.762 (0.644,0.933)
ext_clean2
0.981 (0.974,0.987)
0.923 (0.911,0.933)
0.984 (0.978,0.989)
0.991 (0.986,0.995)
0.948 (0.937,0.964)
0.974 (0.967,0.982)
ext_phoneme
0.868 (0.855,0.882)
0.748 (0.735,0.76)
0.83 (0.815,0.844)
0.857 (0.843,0.872)
0.819 (0.802,0.828)
0.878 (0.866,0.895)
ext_schizo
0.333 (0.333,0.333)
0.422 (0.35,0.493)
0.457 (0.397,0.548)
0.387 (0.348,0.445)
0.382 (0.342,0.431)
0.337 (0.327,0.357)
ext_spectf
0.852 (0.801,0.925)
0.793 (0.709,0.867)
0.888 (0.845,0.938)
0.847 (0.776,0.907)
0.855 (0.777,0.915)
0.845 (0.785,0.913)
int_BVN
0.818 (0.797,0.831)
0.764 (0.745,0.779)
0.844 (0.828,0.859)
0.848 (0.829,0.863)
0.818 (0.801,0.835)
0.835 (0.818,0.846)
int_coverity
0.515 (0.485,0.586)
0.832 (0.767,0.923)
0.515 (0.488,0.595)
0.499 (0.496,0.5)
0.702 (0.594,0.884)
0.5 (0.5,0.5)
int_severity
0.714 (0.659,0.784)
0.851 (0.805,0.884)
0.578 (0.538,0.614)
0.509 (0.497,0.525)
0.784 (0.733,0.84)
0.577 (0.546,0.617)
int_tnfa
0.737 (0.64,0.862)
0.696 (0.586,0.772)
0.766 (0.662,0.852)
0.741 (0.662,0.833)
0.721 (0.581,0.824)
0.726 (0.635,0.811)
int_virabac
0.88 (0.848,0.901)
0.869 (0.848,0.889)
0.883 (0.857,0.904)
0.879 (0.853,0.903)
0.876 (0.848,0.899)
0.881 (0.854,0.905)
Table 4: Balanced Accuracy performance. The best result for each dataset is highlighted in bold
Ranking Classifiers
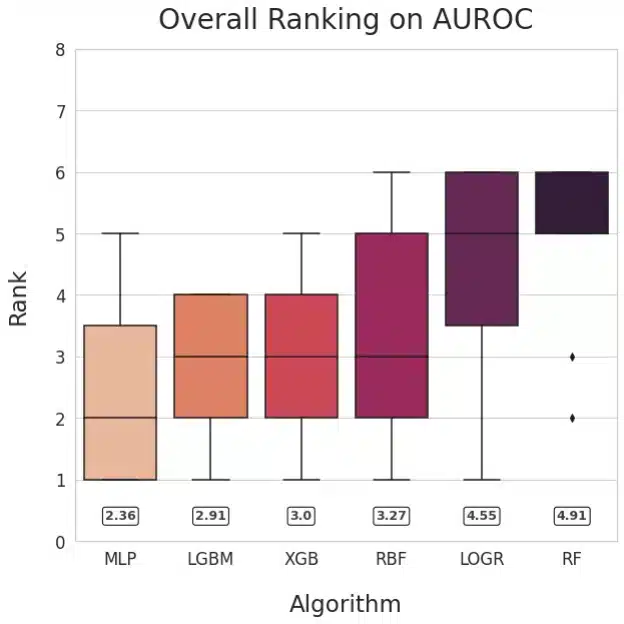
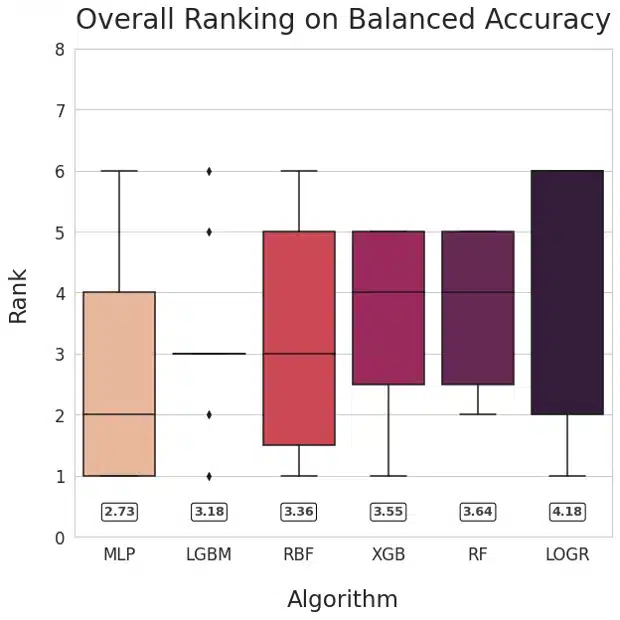
Figure 1: Ranking of methods based on AUROC (left) and Balanced Accuracy (right)
Our main goal was to compare neural networks with non-NN algorithms. To facilitate answering that question, we visualized the relative performance of the learning algorithms by ranking their performance for each dataset and plotting the averaged ranks for each method. This method is inspired by Friedman’s M statistic and is used commonly for algorithm comparison (Brazdil, 2000). The numerical values of mean ranks for each of the learning algorithms are shown in the rounded boxes. The plots for AUROC and Balanced Accuracy rank MLP the highest followed by LGBM.
Pairwise comparison of Classifiers
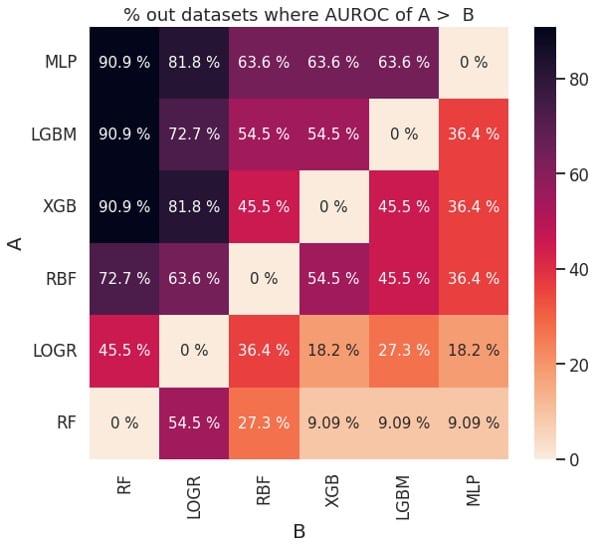
Figure 2: Pairwise comparison of performance based on AUROC (left) and balanced accuracy (right)
The plots in Figure 2 can also be used to determine if one learning algorithm is better than another. For example, MLP (classifier A) outperforms XGB (classifier B) about 63.6 % of the time based on AUROC and about 72.7% of the time based on balanced accuracy. This is consistent with the ranks for MLP and XGB in Figure 1.
Discussion
Our key observation is that Multi-Layer-Perceptron outperformed gradient-boosted-tree-based learning algorithms (XGBoost and LightGBM), though the differences were small. Support Vector Machine, Logistic Regression, and Random Forest were inferior to other methods considered.
We are aware that XGBoost and other decision tree-based algorithms have a significant following among ML practitioners who work with tabular data (Shwartz-Ziv, 2022) and were wondering why it seemed to underperform on the datasets that we considered. To that end, we examined recent publications comparing the classifiers (Gorishniy, 2021; Gorishniy, 2022, Borisov 2021), and noticed that the datasets they used fell into two distinct groups:
datasets with exclusively continuous features (we refer to them as homogenous tabular datasets)
datasets with a combination of discrete and continuous features (we refer to them as heterogeneous tabular datasets).
Further we noticed that in these studies neural networks outperformed tree-based algorithms on 12 out of 12 homogenous tabular datasets, whereas XGBoost outperformed neural networks on 4 out of 5 heterogenous tabular datasets. We also recognize that tree-based algorithms are better suited at handling discrete features by design than neural networks. Based on these considerations, we hypothesize that XGBoost may be superior for heterogeneous tabular datasets, and neural networks are best suited for homogeneous tabular datasets.
This analysis has limitations. Since we only look at classification tasks on small tabular datasets with numerical features, our conclusions might not extend to regression tasks, heterogenous or larger tabular datasets. It is possible that the hyperparameter tuning could be improved, potentially affecting the algorithms rankings and the conclusions. Since we use 5-fold random cross-validation for practical reasons, our findings could be strengthened by introducing independent validation data, where available, and evaluating other types of cross-validation.
In conclusion, we did not find convincing evidence to claim that neural networks outperform non-neural network algorithms on small tabular datasets, but we also did not observe superior performance by decision tree-based methods (XGBoost, LGBM, RandomForest). We hypothesize that decision tree-based learning algorithms may be best for datasets that have a combination of continuous and categorical features, but not necessarily for datasets with exclusively numerical features. This hypothesis requires further research.
Burlingame, Calif., June 15, 2022 — Inflammatix, Inc., a pioneering molecular diagnostics company, announced today the appointment of Purvesh Khatri, PhD, as Chief Scientific Officer. As a co-founder of Inflammatix, Dr. Khatri had previously served as a Scientific Advisor to the company while serving as Associate Professor at Stanford University’s Institute for Immunity, Transplantation, and Infection.
Dr. Khatri possesses more than 15 years of experience in bioinformatics, computational biology, and translational medicine. He is well-known for his work on ontological and pathway analysis of high-throughput molecular, genomics, and proteomics data. Dr. Khatri developed the first ontology tool for analysis of microarray data, named Onto-Express, and has expanded into a suite of web-based open access tools, Onto-Tools.
His most recent work focused on developing computational methods for integrated, multi-cohort analysis of publicly available data to increase sample size, as well as better account for the heterogeneity observed in real world patient populations. Using these methods, he has identified highly specific and sensitive biomarkers for: (1) infectious diseases (sepsis, respiratory infections, tuberculosis), (2) acute solid-organ transplant rejection, and (3) cancer (pancreatic cancer, small cell and non-small cell lung cancer, mesothelioma). Dr. Khatri has authored or co-authored more than 140 papers and holds 30-plus patents.
“Purvesh is a world leader in using complex clinical and biological datasets to develop new diagnostic, prognostic and predictive models, and new therapeutic insights. He has been with us since day one, and we are thrilled to bring him onboard full-time to lead our scientific teams through ever-greater discoveries and translational breakthroughs,” said Inflammatix CEO and Co-Founder Timothy Sweeney, MD, PhD.
Dr. Khatri added, “I am excited to make a full-time commitment to Inflammatix as it continues its work to address important unmet needs in the diagnosis of acute illness. The team has made a great deal of progress since we founded the company, and I am delighted to join them in their next phase of growth and discovery. I am confident that we will continue to innovate to improve upon current diagnostic methods and enable the highest level of patient care possible.”
About Inflammatix
Inflammatix, Inc., is an innovative molecular diagnostics company developing novel diagnostics that rapidly read a patient’s immune system to improve care and reduce major public health burdens. The company’s initial focus is acute infections and sepsis, where its tests combine proprietary biomarkers and advanced machine learning to help physicians quickly get the right treatments to the right patients. Each test will be developed to run on the company’s sample-to-answer isothermal instrument platform, enabling the power of precision medicine at the point of care. The Redwood City, Calif.-based company is funded by Khosla Ventures, Northpond Ventures, D1 Capital Partners, Think.Health Ventures, the Stanford StartX Fund, and OSF Ventures.
Media Contact
Michelle McAdam, Chronic Communications, Inc. [email protected] 310.902.1274
Burlingame, Calif., November 30, 2021 — Inflammatix, a pioneering molecular diagnostics company, announced today the appointment of Kian Beyzavi, PhD, as an independent member of the company’s board of directors.
Dr. Beyzavi is a seasoned veteran of the healthcare industry with significant operating experience in the medical device and diagnostics industries, and a focus on leveraging innovative technologies to improve diagnosis and delivery of care. Since starting her career at McKinsey & Company, she has over 25 years of experience as a venture investor, entrepreneur, consultant, and general manager at Rho Ventures, Cubit Software, Medtronic, Abbott Diabetes Care and Novartis Diagnostics. Through her work with multiple stakeholders, Kian has developed a systems-level view of the complex healthcare ecosystem. For the past 10 years she has led a specialized consulting firm advising Fortune 500 companies, startups and others in the areas of strategy, product development, business model innovation, commercialization, and monetization of novel opportunities across life sciences. She is currently a venture partner at Cota Capital, a multistage investment firm.
“We are delighted to welcome Kian to the board. She brings a wealth of vision and deep commercialization experience across diagnostics to her new role with the company. We are drawn to her commitment to leverage technology in improving healthcare and are eager to tap into her insights as we utilize AI and genomics in our mission to improve the diagnosis of infection,” said Inflammatix CEO and Co-Founder Timothy Sweeney, MD, PhD.
Dr. Beyzavi added, “I’m thrilled to join the board. Inflammatix is poised to address important unmet needs in the diagnosis of acute illness, which will result in improved treatment decisions and outcomes. I look forward to working with this innovative team as they bring their breakthrough technologies to market.”
About Inflammatix
Inflammatix is a molecular diagnostics company that is reimagining diagnostics by reading the patient’s immune system to deliver rapid results that improve patient care and reduce major public health burdens. The company’s initial focus is on acute infections and sepsis, where its tests combine proprietary biomarkers and advanced machine learning to help physicians quickly get the right treatments to the right patients. Future tests will be developed to run on the company’s sample-to-answer isothermal instrument platform in under 30 minutes, enabling the power of precision medicine at the point of care. The Burlingame, CA-based company is funded by leading medical technology investors including Khosla Ventures, Northpond Ventures, D1 Capital Partners, Think.Health Ventures, and others. For more information, please visit www.inflammatix.com and follow the company on Twitter (@Inflammatix_Inc).
Media Contact
Michelle McAdam, Chronic Communications, Inc. [email protected] 310.902.1274