Decision Threshold Optimization for Diagnostic Tests using a Genetic Algorithm
By Roland Luethy and Ljubomir Buturovic, Inflammatix, Inc.
Introduction
Typically, a clinical classifier generates a score that corresponds to likelihood of disease presence or future outcome. In order to facilitate decision-making, the score is sometimes converted to a discrete classification label using decision thresholds [1]. For binary classification, there is a single threshold that can be chosen using a trade-off between sensitivity and specificity based on a receiver operating characteristic (ROC) curve or similar. However, it is often desirable to partition the range of output scores into multiple bands, corresponding to different likelihoods of the disease/outcome, which in turn requires multiple thresholds that cannot be determined by the inspection of ROC curves. To our knowledge, no effective solution to this problem has been described.
Here, we developed a genetic optimization algorithm for the determination of decision thresholds for multiple output bands, called Genetic Algorithm Thresholds (GAT) (the term “genetic” applies to an optimization method, not genome). We have applied this method to a three-class classifier which diagnoses the presence and type of infection in patients suspected of an acute infection and/or sepsis. The classifier uses the gene expression profile of patients’ immune response as input features and produces scores for a patient sample indicating the probability of bacterial infection, probability of viral infection and probability of no infection.
Methods
To improve interpretability and guide treatment actions, each probability (score) is partitioned to likelihood bands such that each probability range [0, 1] is divided into five disjoint decision intervals (Fig. 1). Thus, in our application, each of the three probabilities of disease (bacterial, viral, and no infection) is divided into five bands. For example, if a given patient’s scores are in the very likely band for the viral infection (very high probability of viral infection) and very unlikely band for bacterial infection (very low probability of bacterial infection), treatment with antibiotics may not be beneficial.
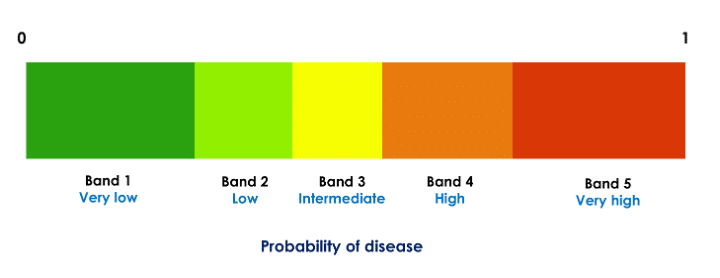
Figure 1: Partitioning of a classifier probability in five decision bands. Each of the three class probabilities computed by the classifier is partitioned into five such bands. The thresholds are specific to the probabilities and are computed independently for each class.
The decision thresholds, which define the bands, should be chosen using clinically meaningful criteria. For example, we could specify that both the confidence in and the number of patients assigned to the “extreme” bands (lowest or highest probability band) should be as high as possible because those are the clinically most actionable bands. We represent stringency for each band using diagnostic likelihood ratios (LR) [2]. For example, for the bacterial and viral scores the clinical considerations (obtained through input from clinician community) suggest LR for the lowest band should be at most 0.075 and for the highest band at least 7.5. Furthermore, for the test to demonstrate utility at a population level, a meaningful percentage of patients should fall in the extreme bands and few patients should result in the non-informative middle (indeterminate) band (e.g., at least 50% patients should be in the extreme bands and at most 10% in the middle band). To balance these requirements and to find thresholds that generate bands (decision thresholds) meeting them, we developed a tool using a genetic algorithm with a cost function encapsulating the desired criteria.
Dataset Overview
The training set for the classifier consists of 29 genes (input features) profiled in 3159 patients from 42 clinical studies, assayed on gene expression microarrays. The validation set comprises 741 samples from 9 independent clinical studies, using the same 29 input features measured on the Nanostring nCounter(R) platform [3]. To ensure consistency and accuracy, both the training and validation sets were normalized using samples from healthy patients, with the Nanostring platform serving as a reference. The classifier is an advanced version of a previously published one [4].
Algorithm Overview
We implemented the Genetic Algorithm Thresholds (GAT) algorithm, shown below, in python using the DEAP library [5, 6]. We apply the steps 1 through 4 independently to each output class (i.e., set of bacterial, viral, and non-infected probabilities) to optimize the corresponding decision thresholds. At the completion of the analysis, 12 thresholds are generated (4 for each class).
- The initial population for the evolutionary (genetic) algorithm is randomly generated. A set of ‘chromosomes,’ each representing a potential solution to the problem, is created (the term “chromosome” applies to a vector representing a set of thresholds, not a DNA fiber in cell nucleus). The chromosome corresponding to a solution has four values, representing the 4 thresholds needed to split the probabilities into 5 bands.
- The fitness of each chromosome in the population is evaluated using a fitness function. The function assigns a fitness score to each chromosome based on how well it fits the desired criteria for LR1, LR5, percentage of patients in band 1 and band 5 combined (coverage) and percentage of patients in band 3. The coverage is only considered if the value is below the target value, so that coverage exceeding the target is not penalized.
- A new generation is created by selecting parents according to their fitness. Offspring are created using crossover and mutation operations. The individuals with the top 20% fitness are always kept in the population.
- Steps 2 and 3 are repeated for a given number of iterations until there is no improvement of the best solution.
Results
We trained the classifier on the training set and applied the tuned classifier to the validation set. Then we applied GAT to the validation set probabilities. The results are summarized in Table 1. It shows the target values that were used for GAT and the actual values with the best thresholds found by GAT for the bacterial and viral probabilities.
| Target value | Achieved value (bacterial) | Achieved value (viral) | |
| LR1 (lowest band) | 0.075 | 0.089 | 0.101 |
| LR5 (highest band) | 7.5 | 8.688 | 9.678 |
| % in band 1 and 5 | 50 | 69.8 | 69.1 |
| % in band 3 | 7.5 | 8.6 | 10 |
Table 1: Target values and achieved values for the three-class infectious disease classifier. GAT does not guarantee that all target values will be achieved. Nevertheless, overall performance was deemed adequate.
Figure 2 shows the bacterial and viral probabilities and the thresholds for the classifier, where blue and red dots represent patients with bacterial or viral infection, respectively. The green dots represent patients with inflammation that are not caused by bacterial nor viral infections. The dotted lines represent the thresholds determined using GAT. The thresholds let us assign each sample to one of five bacterial and five viral likelihood bands. Samples that fall in bacterial band 1 are very unlikely to be bacterial infections, whereas samples in bacterial band 5 are very likely bacterial infections. Similarly, samples that fall in viral band 1 are very unlikely to be viral infections, whereas samples in viral band 5 are very likely viral infections. Figure 3 shows that most patients with bacterial infections are in bacterial band 5 and viral band 1 and most patients with viral infections are in bacterial band 1 and viral band 5.
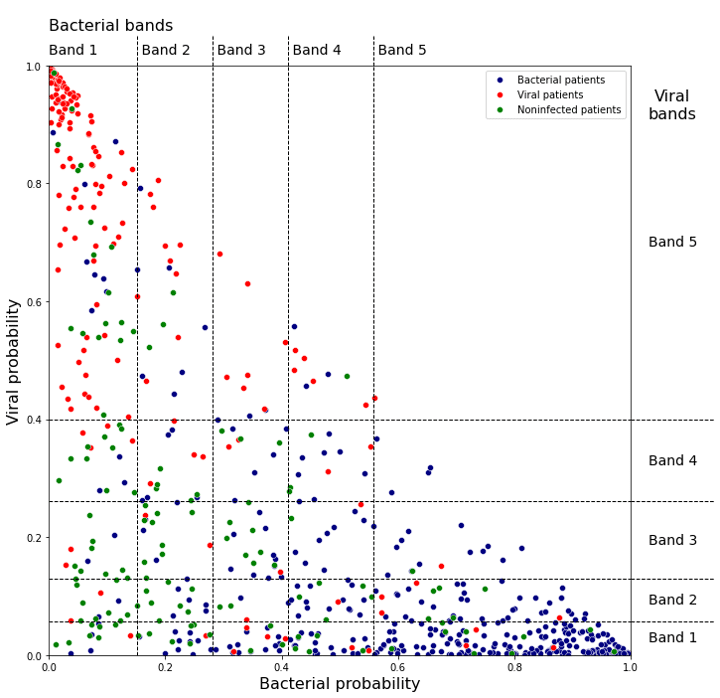
Figure 2: Assignment of bacterial and viral probabilities to likelihood bands. The dotted lines are the thresholds determined using GAT.
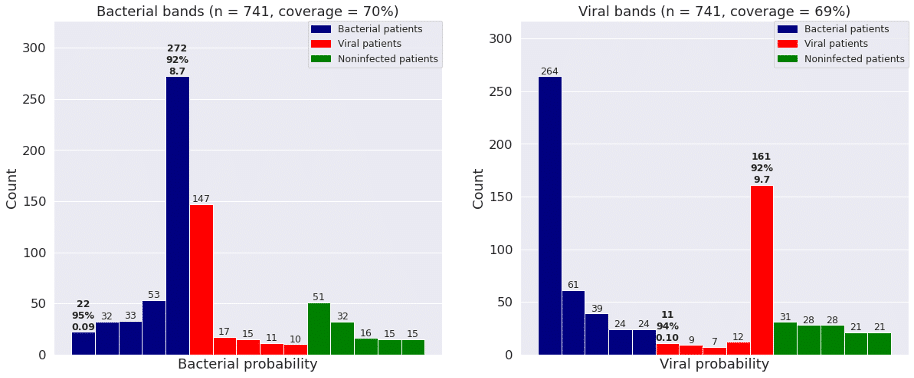
Figure 3: Frequency of patients with bacterial infections, viral infections, and no infections in each of the five bacterial and viral bands defined by GAT. “Coverage” is percent of patients in bands 1 and 5.
Conclusion
We found that GAT enables efficient optimization of decision thresholds using an arbitrary number of decision regions (bands) and an arbitrary fitness function. We intend to use this method to define decision thresholds for the TriVerityTM Acute Infection and Sepsis Test, currently in development at Inflammatix.
References
- https://www.canassistbreast.com/sample-report.php
- Hayden SR, Brown MD. Likelihood ratio: a powerful tool for incorporating the results of a diagnostic test into clinical decision making. Annals of emergency medicine. 1999 May 1;33(5):575-80.
- Kulkarni MM. Digital multiplexed gene expression analysis using the NanoString nCounter system. Current protocols in molecular biology. 2011 Apr;94(1):25B-10.
- Mayhew MB, Buturovic L, Luethy R, Midic U, Moore AR, Roque JA, Shaller BD, Asuni T, Rawling D, Remmel M, Choi K. A generalizable 29-mRNA neural-network classifier for acute bacterial and viral infections. Nature communications. 2020 Mar 4;11(1):1177.
- Fortin FA, De Rainville FM, Gardner MA, Parizeau M, Gagné C. DEAP: Evolutionary algorithms made easy. The Journal of Machine Learning Research. 2012 Jul 1;13(1):2171-5.
- Wirsansky E. Hands-on genetic algorithms with Python: applying genetic algorithms to solve real-world deep learning and artificial intelligence problems. Packt Publishing Ltd; 2020 Jan 31.