Searching for the Best Tabular Data Classifiers
By Nandita Damaraju, Ljubomir Buturovic, Inflammatix, Inc.
Are neural networks better than other machine learning algorithms on small tabular data?
Introduction
Deep Neural Networks (DNN) models outperform conventional machine learning algorithms on unstructured data modalities such as images, text, and audio. However, their application to modeling structured tabular data has not been as successful. Tabular Datasets are used in a variety of domains including medicine, finance, manufacturing, climate science. Many applications (for example, medicine) also use tabular datasets that are smaller (< 10 K samples) because samples are expensive to acquire. Given the wide use of such datasets, it would be beneficial to know which ML algorithms perform best when applied to small tabular data. Recent studies to that end (Gorishniy, 2021; Gorishniy, 2022) have been inconclusive because
- The results differ among studies and
- They used large datasets (Borisov, 2021)
In this study, we carried out an experimental comparison across different algorithms that include neural network-based algorithms against non-neural network machine learning algorithms on such tabular data.
Methodology
Dataset Overview
There are many standard data sets to compare new deep learning architectures against existing baselines such as MNIST, CIFAR, and ImageNet for image classification. In contrast, there are no established standard tabular data sets. This is addressed partly by the Penn Machine Learning Benchmark (Olson, 2017), that provides the largest collection of diverse, public benchmark datasets for evaluating new machine learning methods. The database includes many modalities of data, including tabular datasets. In this study, we used a combination of PMLB datasets and internal Inflammatix datasets. We focused on numeric features and classification problems because we have the most expertise working with such data. All the datasets used for this analysis are outlined in Table 1.
We used 6 datasets from the PMLB database. The criteria were as follows:
- fewer than 10,000 samples
- either binary or three-class multiclass classification tasks
- the number of samples corresponding to the least common class label was above 2% of the total dataset.
Only the numerical features corresponding to these datasets were used for further analyses.
In addition to the 6 datasets above, we also use 5 datasets generated internally at Inflammatix. These datasets are also tabular and use gene expression values as features. We use gene expression data to build classifiers to diagnose various infectious diseases. In this context, each input sample (vector) represents one person (patient), features correspond to genes, and the classes correspond to different diseases or disease states. Each feature value is a measurement of the abundance of the corresponding gene in each tissue type (e.g., blood sample), using a suitable measurement platform such as qPCR. The task is to classify the patient’s disease accurately using the gene measurements as input features.
| dataset | #features | #classes | #samples | class 0 | class 1 | class 2 |
|---|---|---|---|---|---|---|
| ext_ann_thyroid | 21 | 3 | 7200 | 92.6% | 2.3% | 5.1% |
| ext_appendicitis | 7 | 2 | 106 | 80.2% | 19.8% | – |
| ext_clean2 | 166 | 2 | 6598 | 84.6% | 15.4% | – |
| ext_phoneme | 5 | 2 | 5404 | 70.7% | 29.3% | – |
| ext_schizo | 11 | 3 | 340 | 22.9% | 58.8% | 18.2% |
| ext_spectf | 44 | 2 | 349 | 27.2% | 72.8% | – |
| int_BVN | 29 | 3 | 3159 | 32.5% | 33.2% | 34.3% |
| int_COV | 6 | 2 | 705 | 96.7% | 3.3% | – |
| int_SEV | 29 | 2 | 2622 | 94.6% | 5.4% | – |
| int_TNF | 7 | 2 | 136 | 47.8% | 52.2% | – |
| int_VIB | 7 | 2 | 1123 | 40.4% | 59.6% | – |
Algorithm Overview
We compared the performance of 7 different learning algorithms on these datasets as summarized in Table 2. We include three learning algorithms based on decision trees, XGBoost, LightGBM and Random Forest. We focused on the comparison of these tree-based classifiers with neural network classifiers MLP (Multi-Layer Perceptron) and TabNet (Arık, 2021). We also included Logistic Regression and Support Vector Machine algorithms as benchmarks.
| Algorithm | Overview | Abbr. |
|---|---|---|
| LightGBM | Distributed gradient boosting framework using decision trees | LGBM |
| Logistic Regression | Linear method for classification, often a good benchmark | LOGR |
| Multi-Layer Perceptron | Fully connected feedforward artificial neural network | MLP |
| Support Vector Machine | Support Vector Machine with RBF kernel | RBF |
| Random Forests | Ensemble of multiple decision trees | RF |
| TabNet | Deep Learning framework based on sequential attention | TabNet |
| XGBoost | Gradient boosting framework that uses tree-based methods | XGB |
Evaluating Models
We evaluated the methods using Area Under Receiver Operating Characteristic curve (AUROC) and balanced accuracy as the scoring metrics (Provost, 2003). AUROC is a metric to measure the degree of separability of different classes, for a given classifier. While it is traditionally defined for binary classification, a macro-average of the one-vs-one AUROC values was used for multiclass problems (Hand and Till, 2000). Balanced Accuracy is the arithmetic mean of sensitivity and specificity. It is used for both binary and multiclass classification with imbalanced classes. Since the datasets have a class imbalance, balanced accuracy was preferred over accuracy.
For each ML (Machine Learning) method, we first scaled the features of the datasets and then performed a comprehensive hyperparameter search of each of the ML method’s parameters using random 5-fold cross-validation to find the best parameters (according to AUROC) for each ML method on each data set.
Comparing model performance
Performance Overview
To compare the performance for each method in Table 2, the AUROC and Balanced Accuracy were computed for each algorithm and tabulated in Table 3 and 4. The corresponding 95% Confidence Intervals are also indicated. We ignored TabNet for all further analysis because of the increased run time and inferior performance.
| Dataset | LGBM | LOGR | MLP | RBF | RF | XGB |
| ext_ann_thyroid | 1.0 (1.0,1.0) |
0.994 (0.991,0.995) |
0.988 (0.982,0.994) |
0.986 (0.981,0.99) |
0.999 (0.998,1.0) |
1.0 (1.0,1.0) |
| ext_appendicitis | 0.861 (0.744,0.963) |
0.861 (0.687,0.96) |
0.873 (0.774,0.956) |
0.864 (0.709,0.963) |
0.833 (0.692,0.961) |
0.854 (0.698,0.974) |
| ext_clean2 | 1.0 (1.0,1.0) |
0.979 (0.975,0.983) |
0.999 (0.999,1.0) |
1.0 (0.999,1.0) |
0.995 (0.993,0.996) |
0.999 (0.999,1.0) |
| ext_phoneme | 0.949 (0.942,0.955) |
0.814 (0.802,0.829) |
0.93 (0.922,0.938) |
0.939 (0.93,0.947) |
0.929 (0.919,0.935) |
0.955 (0.948,0.962) |
| ext_schizo | 0.629 (0.568,0.691) |
0.648 (0.591,0.706) |
0.648 (0.596,0.719) |
0.644 (0.598,0.693) |
0.591 (0.547,0.643) |
0.628 (0.565,0.684) |
| ext_spectf | 0.948 (0.919,0.975) |
0.895 (0.851,0.946) |
0.954 (0.927,0.982) |
0.938 (0.887,0.982) |
0.951 (0.92,0.977) |
0.939 (0.9,0.966) |
| int_BVN | 0.945 (0.938,0.953) |
0.905 (0.893,0.914) |
0.95 (0.942,0.957) |
0.953 (0.944,0.96) |
0.942 (0.932,0.952) |
0.948 (0.94,0.956) |
| int_coverity | 0.902 (0.81,0.956) |
0.903 (0.87,0.945) |
0.903 (0.822,0.954) |
0.871 (0.728,0.95) |
0.869 (0.804,0.936) |
0.905 (0.834,0.966) |
| int_severity | 0.915 (0.888,0.933) |
0.922 (0.891,0.938) |
0.93 (0.911,0.951) |
0.902 (0.876,0.929) |
0.905 (0.873,0.932) |
0.924 (0.901,0.94) |
| int_tnfa | 0.816 (0.716,0.904) |
0.787 (0.686,0.877) |
0.812 (0.683,0.909) |
0.815 (0.736,0.901) |
0.786 (0.675,0.892) |
0.797 (0.688,0.868) |
| int_virabac | 0.942 (0.916,0.958) |
0.941 (0.915,0.954) |
0.949 (0.929,0.962) |
0.945 (0.921,0.961) |
0.941 (0.919,0.956) |
0.943 (0.919,0.959) |
A cursory analysis of the AUROC results (Table 3) indicates that MLP is the top performer. Since many AUROC values are high, we also looked at balanced accuracy scores. The balanced accuracy values reveal a similar picture: MLP still seems to outperform the other methods (Table 4).
| Dataset | LGBM | LOGR | MLP | RBF | RF | XGB |
| ext_ann_thyroid | 0.992 (0.978,0.999) |
0.961 (0.946,0.971) |
0.887 (0.852,0.914) |
0.849 (0.827,0.886) |
0.99 (0.982,0.995) |
0.992 (0.983,0.998) |
| ext_appendicitis | 0.762 (0.644,0.899) |
0.775 (0.592,0.911) |
0.715 (0.596,0.863) |
0.786 (0.639,0.932) |
0.762 (0.644,0.899) |
0.762 (0.644,0.933) |
| ext_clean2 | 0.981 (0.974,0.987) |
0.923 (0.911,0.933) |
0.984 (0.978,0.989) |
0.991 (0.986,0.995) |
0.948 (0.937,0.964) |
0.974 (0.967,0.982) |
| ext_phoneme | 0.868 (0.855,0.882) |
0.748 (0.735,0.76) |
0.83 (0.815,0.844) |
0.857 (0.843,0.872) |
0.819 (0.802,0.828) |
0.878 (0.866,0.895) |
| ext_schizo | 0.333 (0.333,0.333) |
0.422 (0.35,0.493) |
0.457 (0.397,0.548) |
0.387 (0.348,0.445) |
0.382 (0.342,0.431) |
0.337 (0.327,0.357) |
| ext_spectf | 0.852 (0.801,0.925) |
0.793 (0.709,0.867) |
0.888 (0.845,0.938) |
0.847 (0.776,0.907) |
0.855 (0.777,0.915) |
0.845 (0.785,0.913) |
| int_BVN | 0.818 (0.797,0.831) |
0.764 (0.745,0.779) |
0.844 (0.828,0.859) |
0.848 (0.829,0.863) |
0.818 (0.801,0.835) |
0.835 (0.818,0.846) |
| int_coverity | 0.515 (0.485,0.586) |
0.832 (0.767,0.923) |
0.515 (0.488,0.595) |
0.499 (0.496,0.5) |
0.702 (0.594,0.884) |
0.5 (0.5,0.5) |
| int_severity | 0.714 (0.659,0.784) |
0.851 (0.805,0.884) |
0.578 (0.538,0.614) |
0.509 (0.497,0.525) |
0.784 (0.733,0.84) |
0.577 (0.546,0.617) |
| int_tnfa | 0.737 (0.64,0.862) |
0.696 (0.586,0.772) |
0.766 (0.662,0.852) |
0.741 (0.662,0.833) |
0.721 (0.581,0.824) |
0.726 (0.635,0.811) |
| int_virabac | 0.88 (0.848,0.901) |
0.869 (0.848,0.889) |
0.883 (0.857,0.904) |
0.879 (0.853,0.903) |
0.876 (0.848,0.899) |
0.881 (0.854,0.905) |
Ranking Classifiers
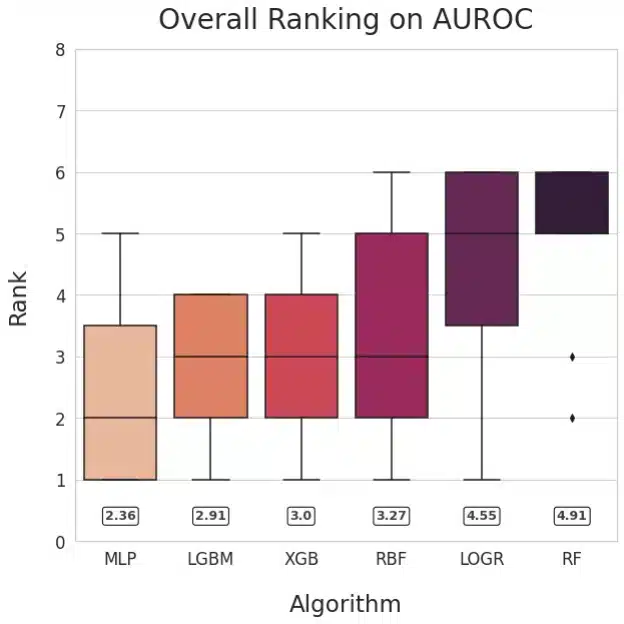
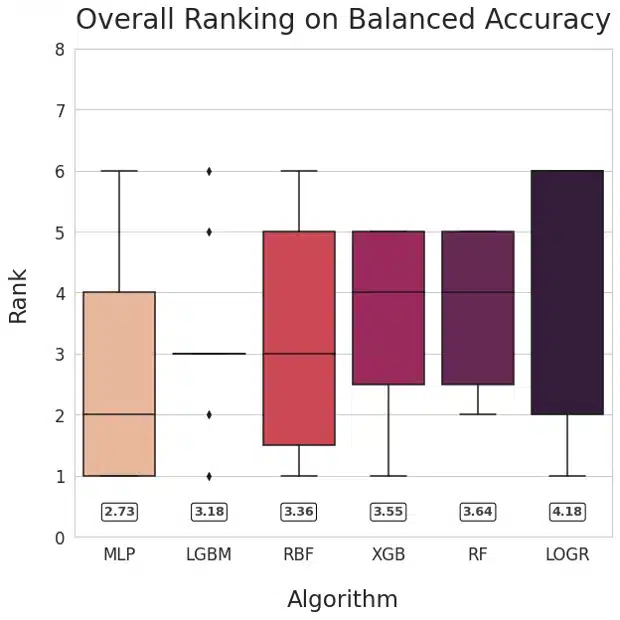
Figure 1: Ranking of methods based on AUROC (left) and Balanced Accuracy (right)
Our main goal was to compare neural networks with non-NN algorithms. To facilitate answering that question, we visualized the relative performance of the learning algorithms by ranking their performance for each dataset and plotting the averaged ranks for each method. This method is inspired by Friedman’s M statistic and is used commonly for algorithm comparison (Brazdil, 2000). The numerical values of mean ranks for each of the learning algorithms are shown in the rounded boxes. The plots for AUROC and Balanced Accuracy rank MLP the highest followed by LGBM.
Pairwise comparison of Classifiers
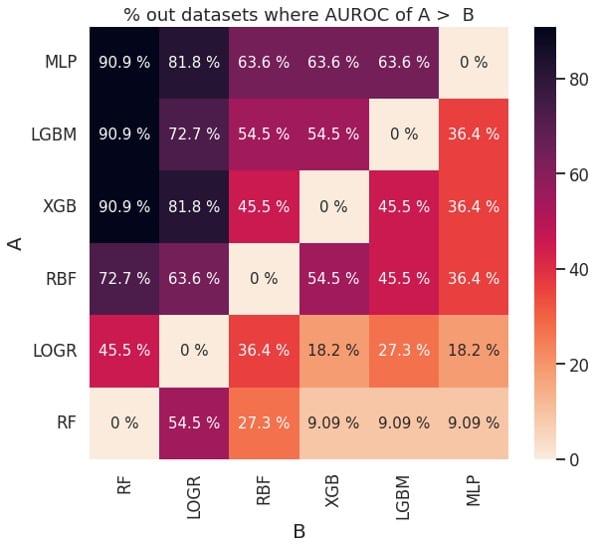

Figure 2: Pairwise comparison of performance based on AUROC (left) and balanced accuracy (right)
The plots in Figure 2 can also be used to determine if one learning algorithm is better than another. For example, MLP (classifier A) outperforms XGB (classifier B) about 63.6 % of the time based on AUROC and about 72.7% of the time based on balanced accuracy. This is consistent with the ranks for MLP and XGB in Figure 1.
Discussion
Our key observation is that Multi-Layer-Perceptron outperformed gradient-boosted-tree-based learning algorithms (XGBoost and LightGBM), though the differences were small. Support Vector Machine, Logistic Regression, and Random Forest were inferior to other methods considered.
We are aware that XGBoost and other decision tree-based algorithms have a significant following among ML practitioners who work with tabular data (Shwartz-Ziv, 2022) and were wondering why it seemed to underperform on the datasets that we considered. To that end, we examined recent publications comparing the classifiers (Gorishniy, 2021; Gorishniy, 2022, Borisov 2021), and noticed that the datasets they used fell into two distinct groups:
- datasets with exclusively continuous features (we refer to them as homogenous tabular datasets)
- datasets with a combination of discrete and continuous features (we refer to them as heterogeneous tabular datasets).
Further we noticed that in these studies neural networks outperformed tree-based algorithms on 12 out of 12 homogenous tabular datasets, whereas XGBoost outperformed neural networks on 4 out of 5 heterogenous tabular datasets. We also recognize that tree-based algorithms are better suited at handling discrete features by design than neural networks. Based on these considerations, we hypothesize that XGBoost may be superior for heterogeneous tabular datasets, and neural networks are best suited for homogeneous tabular datasets.
This analysis has limitations. Since we only look at classification tasks on small tabular datasets with numerical features, our conclusions might not extend to regression tasks, heterogenous or larger tabular datasets. It is possible that the hyperparameter tuning could be improved, potentially affecting the algorithms rankings and the conclusions. Since we use 5-fold random cross-validation for practical reasons, our findings could be strengthened by introducing independent validation data, where available, and evaluating other types of cross-validation.
In conclusion, we did not find convincing evidence to claim that neural networks outperform non-neural network algorithms on small tabular datasets, but we also did not observe superior performance by decision tree-based methods (XGBoost, LGBM, RandomForest). We hypothesize that decision tree-based learning algorithms may be best for datasets that have a combination of continuous and categorical features, but not necessarily for datasets with exclusively numerical features. This hypothesis requires further research.
References
- Gorishniy Y, Rubachev I, Khrulkov V, Babenko A. Revisiting deep learning models for tabular data. Advances in Neural Information Processing Systems. 2021 Dec 6;34.
- Borisov V, Leemann T, Seßler K, Haug J, Pawelczyk M, Kasneci G. Deep neural networks, and tabular data: A survey. arXiv preprint arXiv:2110.01889. 2021 Oct 5.
- Gorishniy Y, Rubachev I, Babenko A. On Embeddings for Numerical Features in Tabular Deep Learning. arXiv preprint arXiv:2203.05556. 2022 Mar 10.
- Arik, S. Ö., & Pfister, T. (2021). TabNet: Attentive Interpretable Tabular Learning. Proceedings of the AAAI Conference on Artificial Intelligence, 35(8), 6679-6687.
- Olson RS, La Cava W, Orzechowski P, Urbanowicz RJ, Moore JH. PMLB: a large benchmark suite for machine learning evaluation and comparison. BioData mining. 2017 Dec;10(1):1-3.
- Provost F, Fawcett T, Kohavi R. The case against accuracy estimation for comparing induction algorithms 1998. InProceedings of the 15th international conference on machine learning ICML-98 Morgan Kaufmann. San Mateo, CA.
- Hand DJ, Till RJ. A simple generalisation of the area under the ROC curve for multiple class classification problems. Machine learning. 2001 Nov;45(2):171-86.
- Brazdil PB, Soares C. A comparison of ranking methods for classification algorithm selection. InEuropean conference on machine learning 2000 May 31 (pp. 63-75). Springer, Berlin, Heidelberg.
- Demšar J. Statistical comparisons of classifiers over multiple data sets. The Journal of Machine Learning Research. 2006 Dec 1;7:1-30.
- Shwartz-Ziv R, Armon A. Tabular data: Deep learning is not all you need. Information Fusion. 2022 May 1;81:84-90.