

Inflammatix collects $57M as it awaits FDA review of infectious disease test

Targeting FDA OK for its test against deadly sepsis, South Bay company raises $57 million
Inflammatix Secures $57 Million to Advance Novel Diagnostic for Patients with Suspected Infections or Sepsis
Fundraise brings lead product, TriVerity™ Test, closer to commercialization following recent submission to FDA.
Sunnyvale, Calif., September 12, 2024 — Inflammatix, a pioneering molecular diagnostics company, announced today the closing of $57 million in Series E financing, led by Khosla Ventures and Think.Health. The funds will support regulatory filing and early commercialization of the company’s lead product, the TriVerity™ Acute Infection and Sepsis Test (TriVerity).
TriVerity is a blood test that is intended to fill a critical need in the emergency department (ED) setting. Each year, 20 million people arrive at the hospital suspected of having an acute infection or sepsis. Recent company-sponsored clinical studies1,2 validate previous research3-5 suggesting that physician assessment and vital-signs-based scoring underestimate severity in up to half of patients suspected of acute infection or sepsis. With an annual incidence of 2.7 million cases and an annual mortality rate of 350,0006, sepsis is a leading cause of death in U.S. hospitals and costs the Centers for Medicare and Medicaid Services (CMS) $53 billion each year, making it the most costly diagnosis among Medicare beneficiaries.7
“The newly raised funds will help us to expand our commercial team and plan clinical interventional and health economic studies as we await FDA clearance over the coming months,” said Dr. Timothy Sweeney, CEO and co-founder of Inflammatix. “TriVerity is bringing the promise of machine learning and AI to infection and sepsis care. We hope to help hospitals improve their performance in terms of complying with sepsis detection and treatment protocols and optimizing patient throughput. We greatly appreciate the strong investor confidence in TriVerity and are excited to be very close to offering this novel test to physicians.”
In addition to the leading investors Khosla Ventures and Think.Health, the Inflammatix Series E funding round included participation from Northpond Ventures, D1 Capital Partners, Iberis Capital, Vesalius BioCapital, OSF Healthcare, RAW Ventures, and others. The funding round brings Inflammatix’s total private capital raised to more than $200 million, in addition to more than $50 million in grants and contracts from various government agencies and foundations.
Novel diagnostic approach to spur earlier detection of infection and sepsis
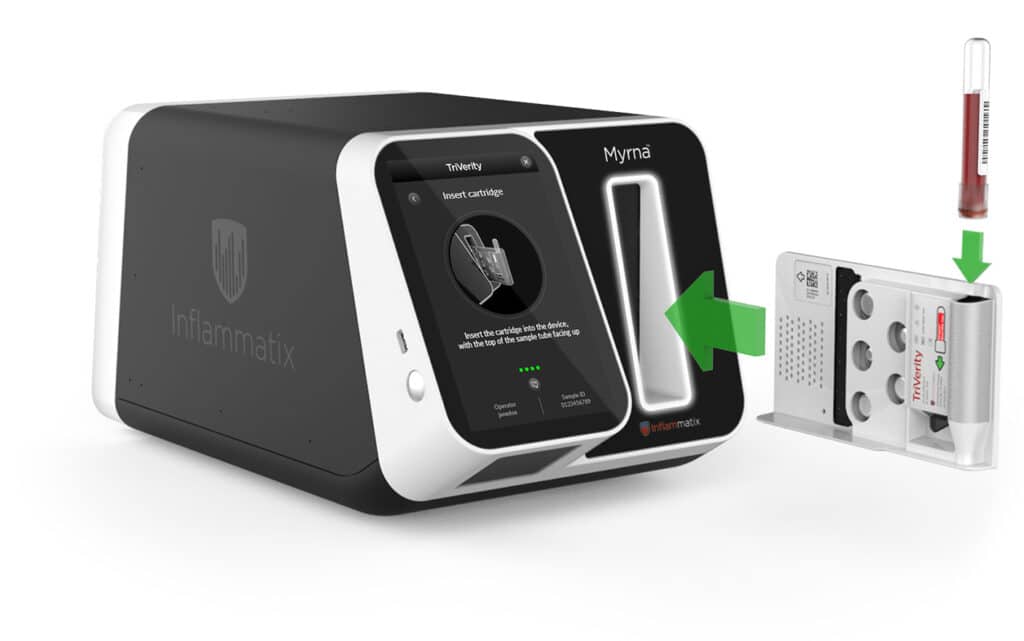
TriVerity, a blood test performed on Inflammatix’s novel Myrna™ Instrument, is uniquely designed to simultaneously determine whether an infection is present, and how likely a patient will need ICU-level interventions. Getting to an accurate diagnosis faster would not only save lives but would also dramatically improve hospital efficiency as well as health system resource allocation. Earlier and more accurate diagnoses may also help hospitals comply with the CMS SEP-1 Bundle, a value-based payments quality measure intended to ensure rapid sepsis detection and treatment.
“Despite incremental improvements in patient outcomes, the death toll from sepsis remains disproportionately high among vulnerable populations,” said Alex Morgan, partner at Khosla Ventures. “The challenge is that existing diagnostics are not able to detect sepsis early enough to trigger timely intervention, and by the time noticeable clinical symptoms appear, it’s often too late. TriVerity takes a novel approach by detecting the RNA changes that occur in immune cells prior to the manifestation of disease, enabling clinicians to respond faster and sometimes before physiological symptoms are even present. This is a step-change in life-saving care that physicians have been wanting for decades.”
After receiving Breakthrough Device Designation from the U.S. Food and Drug Administration (FDA) in November 2023 and completing the SEPSIS-SHIELD study [NCT04094818], Inflammatix recently submitted a regulatory packet to the FDA for the TriVerity Test. The company hopes to receive FDA clearance later this year.
About the TriVerity™ Acute Infection and Sepsis Test
The TriVerity Acute Infection and Sepsis Test (TriVerity), Inflammatix’s lead product, is performed on the Myrna™ Instrument, the company’s proprietary, cartridge-based, benchtop analyzer. TriVerity is a blood test that measures 29 messenger RNAs (mRNAs) to rapidly “read” the body’s immune response to infection using machine learning-derived algorithms. The test is designed to inform on the two “axes” of sepsis — presence of infection and risk of progression to severe illness — in adult patients with suspected acute infection or sepsis in the emergency department setting. TriVerity thus aims to help physicians to confidently make treatment decisions, including selection of antimicrobial therapy, administering additional diagnostic testing, and whether to admit or discharge the patient.
The Myrna Instrument is capable of multiplex sample-to-answer quantitation of mRNAs in about 30 minutes. With its less than one-minute operator hands-on time and simple maintenance, the Myrna Instrument is designed for ease of use and low resource requirements.
The TriVerity Acute Infection and Sepsis Test is not for sale. It is currently pending FDA clearance and has not received marketing approval or clearance from regulatory authorities in any jurisdiction.
About Inflammatix
Inflammatix, Inc., a pioneering molecular diagnostics company headquartered in Sunnyvale, California, USA, is developing novel diagnostics that rapidly read a patient’s immune system to improve patient care and reduce major public health burdens. The Inflammatix tests will be developed to run on the company’s sample-to-answer isothermal instrument platform, enabling the power of precision medicine at the point of care. The company’s funders include Khosla Ventures, Northpond Ventures, Think.Health Ventures, D1 Capital, Iberis Capital, and Vesalius BioCapital. For more information, please visit www.inflammatix.com and follow the company on LinkedIn and X (formerly Twitter) at @Inflammatix_Inc).
Inflammatix product development has been funded in part with Federal funds from the Department of Health and Human Services; Office of the Assistant Secretary for Preparedness and Response; Biomedical Advanced Research and Development Authority, under Contract Nos. 75A50119C00034 and 75A50119C00044.
TriVerity, Myrna, and Inflammatix are trademarks of Inflammatix, Inc. in the U.S. and other countries and regions.
References
- Whitfield N, Michelson EA, Steingrub J, et al. Host response severity score for ICU level care prediction in emergency patients with suspected sepsis. (2024), SAEM24 Abstracts. Acad Emerg Med, 31: 8-401. https://doi.org/10.1111/acem.14906
- Data on file, Inflammatix, Inc.
- Askim A, Moser F, Gustad LT, et al. Poor performance of quick-SOFA (qSOFA) score in predicting severe sepsis and mortality – a prospective study of patients admitted with infection to the emergency department. Scand J Trauma Resusc Emerg Med. 2017;25(1):56. doi: 10.1186/s13049-017-0399-4.
- Tiwari AT, Jamshed N, Sahu AK, et al. Performance of qSOFA score as a screening tool for sepsis in the emergency department. J Emerg Trauma Shock. 2023;16(1):3-7. doi: 10.4103/jets.jets_99_22.
- Freund Y, Lemachatti N, Krastinova E, et al. Prognostic accuracy of Sepsis-3 criteria for in-hospital mortality among patients with suspected infection presenting to the emergency department. JAMA. 2017;317(3):301-308. doi: 10.1001/jama.2016.20329.
- Sepsis. U.S. Department of Health and Human Services, National Institutes of Health, National Institute of General Medical Sciences; 2024. https://www.nigms.nih.gov/education/fact-sheets/Pages/sepsis.aspx?ref=prendi-il-controllo-della-tua-salute.com#:~:text=Each%20year%2C%20according%20to%20the,350%2C000%20die%20as%20a%20result.
- Frank CE, Buchman TG, Simpson SQ, et al. Sepsis among Medicare beneficiaries: 4. Precoronavirus Disease 2019 Update January 2012-February 2020. Crit Care Med. 2021;49(12):2058-2069. doi: 10.1097/CCM.0000000000005332.
Media Contact
Reba Auslander, RAliance Communications
917-836-9308
[email protected]
The TriVerity™ Acute Infection and Sepsis Test System, which includes the Myrna™ Instrument and TriVerity Cartridge, has reached an important milestone with completion of technical development.

Adaptive CV: An approach for faster cross validation and hyperparameter tuning
By Nandita Damaraju, Inflammatix, Inc.
Introduction
Identification of optimal hyperparameters is an integral component for building robust accurate machine learning models. Hyperparameters control various aspects of a classification model such as learning rate, regularization, and model architecture. These hyperparameters influence the time required to train the model and ultimately its performance. Simpler methods such as logistic regression tend to have fewer hyperparameters to tune compared to advanced methods like deep neural networks. As the models become more complex, the possible space of hyperparameter configurations (HCs) increases exponentially and evaluating hyperparameters becomes computationally intensive.
Traditional methods for sifting through the many possible HCs include Grid Search and Random Search. However, these approaches suffer when evaluating models with many hyperparameters as the search space becomes exponentially larger. Methods such as Bayesian Optimization and Hyperband, use relatively lesser computational resources to achieve a comparable result.
A commonly used approach to identify the best performing HC is estimating performance of a model trained using the HC by k-fold cross validation The k-fold cross-validation procedure divides a limited dataset into k non-overlapping parts. Each of the k parts is used as a held back validation set whilst all other parts are collectively used for training. A total of k models are fit and evaluated on the k holdout test sets and average performance metrics are reported. This concept is also used to assess the performance of the HCs by training models with different hyperparameters and evaluating them. However, k-fold cross validation further increases the computational complexity of the problem as it requires a model to be trained and tested k times for each HC.
In this blog, we aim to further reduce the time to identify a top performing HC by truncating cross validation runs that do not show promise. For some HCs, the performance metric tends to be low for most folds in a cross validation run. It is unlikely that these HCs would be top contenders. For such HCs, it would not make sense to train models for later folds if the performance is poor in the first few folds. For example, let’s say a 5-fold CV is used to iterate through HCs for a Multi-Layer Perceptron (MLP). It is possible that the first fold for a particular HC, results in a very low AUC value of 0.6. The AUC values of the next 4 folds wouldn’t be able to compensate for the low AUC value of 0.6 in the first fold, thus unlikely to remain a top contender. Hence it would be a waste of computational time to compute the AUC values for the remaining 4 folds.
If the computation of poor performing HCs is truncated, computational resources can be spent on more promising HCs and the time to iterate through the hyperparameter space will be reduced. This could be useful in cases where there is a high proportion of poor performing HCs or if the algorithm takes a significant amount of time to iterate through each HC.
Data
At Inflammatix, we use gene expression data to build classifiers to diagnose various infectious diseases. In this context, each input sample (vector) represents one person (patient), features correspond to genes, and the classes correspond to different diseases or disease states. Each feature value is a measurement of the abundance of the corresponding gene in a given tissue type (e.g., blood sample), using a suitable measurement platform such as qPCR. The task is to classify the patient’s disease accurately using the gene measurements as input features.
We used two datasets for this blog post (see table below). We used the samples in the training set with cross validation to identify top performing models. For both studies, we used the separate held-out validation set to evaluate these models and create the final model.
| Dataset | #Features | #Classes | #Training Samples | #Validation Samples |
| BVN | 29 | 3 | 3159 | 741 |
| Severity | 29 | 2 | 2622 | 1060 |
Approach
The modified cross validation approach is described as follows (see Figure 1) :
- Establish a performance threshold for the algorithm, for example an AUC of 0.7
- For each HC
- Compute the chosen metric for the first fold
- If the metric is above the threshold, proceed to the next fold
- If the metric is below the threshold, do not compute the metrics for the remaining folds and skip to next HC
- Continue this process, either until the value for a fold is below the threshold or until all folds are completed.
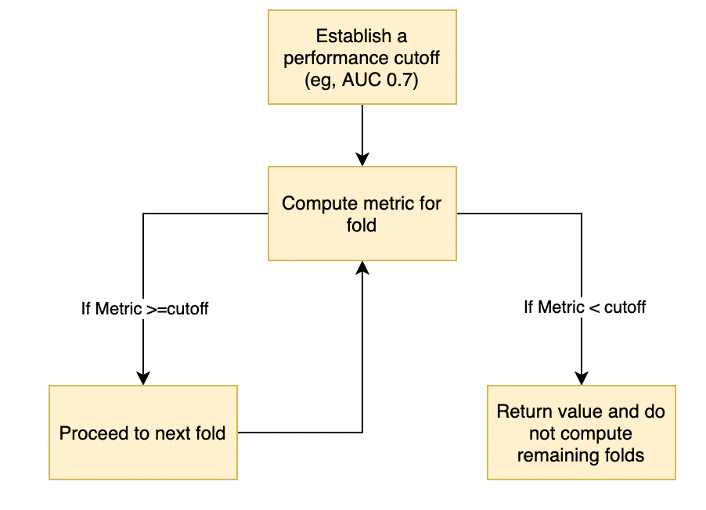
Figure 1: Flowchart to describe the adaptive CV approach
This would result in one single best performing hyperparameter configuration based on the cross-validation performance for a given method. The performance of the top performing HC for different methods are then evaluated on a separate held-out validation set.
Identifying good candidates
How do we identify scenarios where this approach could result in a significant reduction in training time?
We plotted the pooled cross validation AUC values (X-axis) against the fraction of AUCs that are below these values (Y-axis) for 4 different algorithms RBF, MLP, LOGR and XGBoost (see Figure 2). An ideal candidate would have (1) a significant proportion of HCs below a cutoff threshold, and (2) a gradual increase in AUC values as opposed to a sharp rise as a sharp rise would make it harder to select a robust threshold value.
MLPs had over 60% of HCs below an AUC of 0.75. XGBoost on the other hand demonstrated a sharp rise and a narrow range of AUC values (see Figure 2), making it hard to determine a suitable cutoff and hence making XGB unsuitable for this approach. LOGR and RBF also had only ~20% of their values below 0.75, hence making it harder to justify the usage of these algorithms for less than a 20% reduction in time. Therefore, we chose MLPs to test the efficacy of this approach.
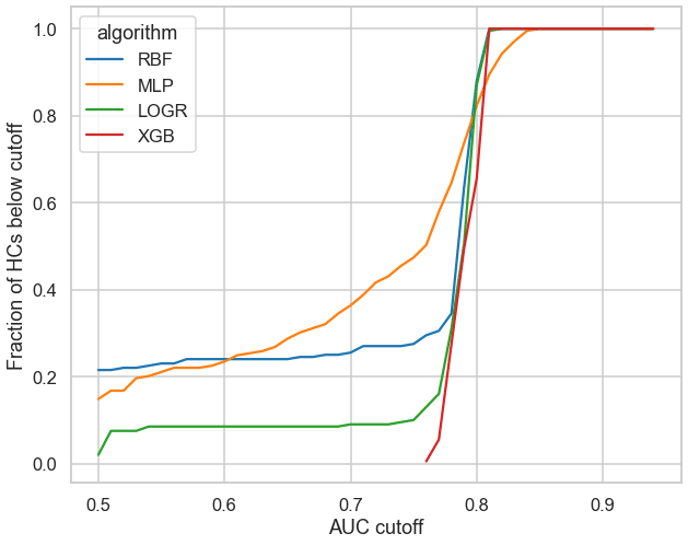
Figure 2: Fraction of HCs (y-axis) above threshold values (x-axis)
Experimental Setup
We used MLPs with both 5 and 10-fold cross validation experiments. We tuned hyperparameters using Hyperband with either AUC or accuracy as the performance metric. We compared the running time, Cross Validation (CV) performance and the held-out-validation data (Validation) performance for various thresholds.
Results
The following plots depict four experiments. We evaluated the running time, cross validation (CV) performance, and the held-out-validation data (Validation) performance for different threshold values as shown on the x-axis.
The green bars represent the corresponding running time on the y axis on the left. The distance between a green bar and the horizontal green baseline performance value denotes the reduction in running time for a particular threshold. The lower the height of the green bars, the higher the reduction in running time.
The y-axis on the right indicates the performance, with validation in blue and CV performance in red. The green blue and red horizontal lines illustrate the baseline (without any threshold) running time, validation, and CV performance. Ideally, we would want the dots to be very close to their respective baseline values represented by the horizontal lines since we do not want to see a reduction in performance.
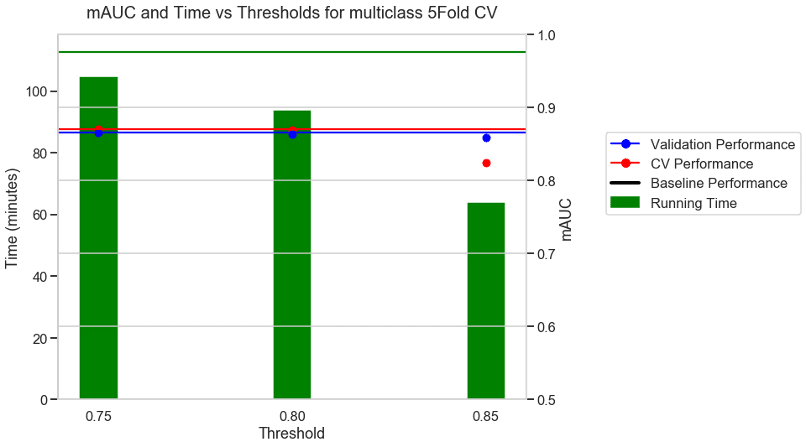
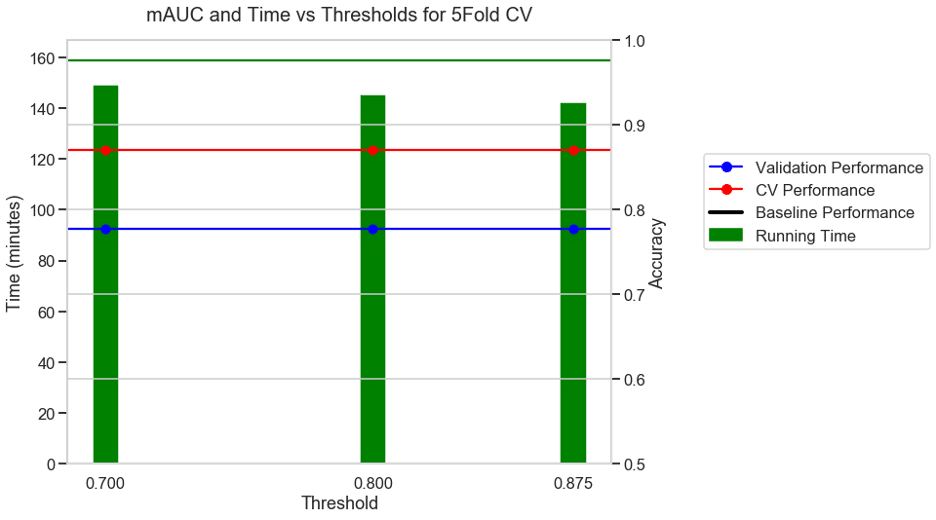
Experiment 1: 5FOLD CV + mAUC as metric + BVN multi class dataset
The first experiment used the multi-class BVN dataset and a 5-fold CV with AUC as the performance metric. With no threshold the baseline took 112 minutes to run as shown by the green horizontal line. With a moderate threshold of about 0.75 there was a 9% reduction in running time and similar performance to the baseline. With a stricter threshold of 0.8, there was a 17% reduction in running time and a similar performance to the baseline. With a very aggressive threshold of 0.85 there was a 43% reduction in running time and a reduction in the CV performance, but no reduction in the validation performance.
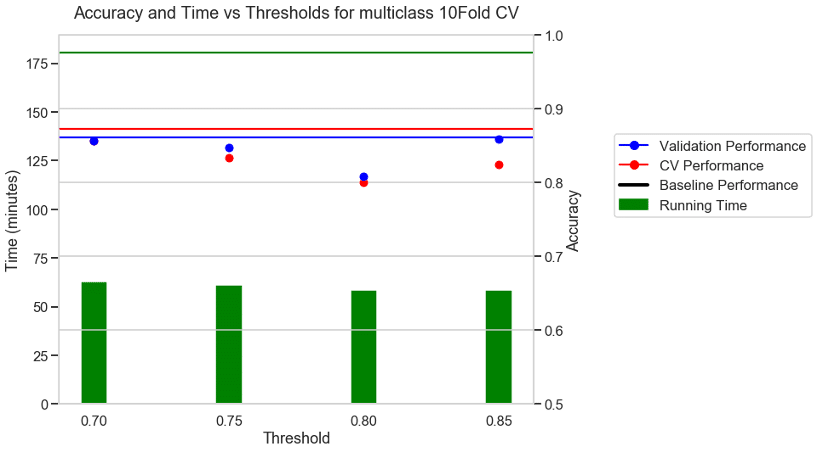
Experiment 2: 10 FOLD CV + Accuracy as metric + BVN multi class dataset
For a 10-fold CV some of the folds did not have all the classes present. In those cases, AUC is not defined and hence we chose accuracy as the metric for 10-Fold CV. The baseline with no threshold took 180 minutes to run. With a moderate threshold of about 0.7 there was a 66% reduction in running time and a small reduction in CV performance. With a stricter threshold of 0.8 and 0.85 there was a 70% reduction in running time, but a higher reduction in the performance values.
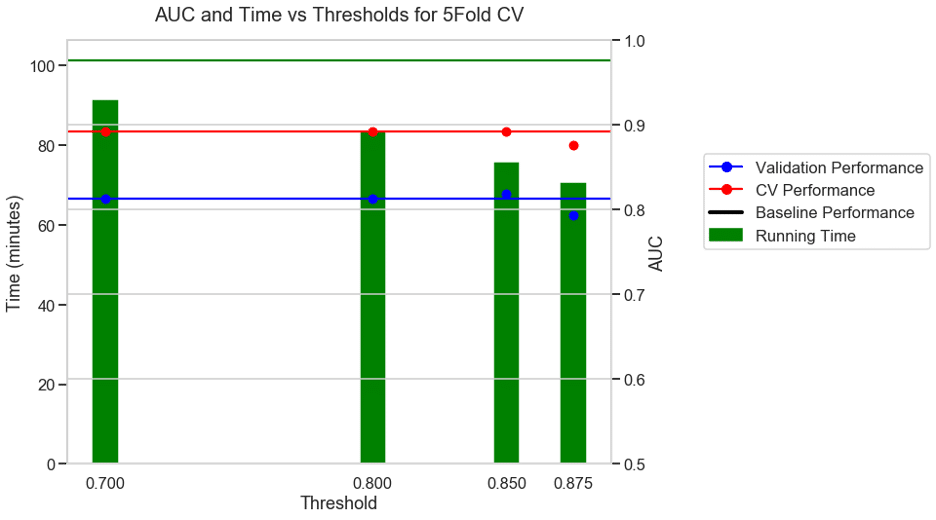
Experiment 3: 5 FOLD CV + AUC as metric + S3 binary classification dataset
For a binary classification dataset (S3) the run time without a threshold was 101 minutes. With a moderate threshold of 0.7, there was a 10% reduction in running time and with an aggressive threshold of 0.875 there was a 31% reduction in running time with a modest drop in performance.
Experiment 4: 10 FOLD CV + Accuracy as metric + S3 binary classification dataset
For the same binary classification dataset, with a 10-fold CV and accuracy as the choice of metric, the baseline took 158 minutes. With a moderate threshold of 0.7, there was a 5% reduction in running time and with an aggressive threshold of 0.875 there was a 10% reduction in running time and no reduction in performance.
Discussion
With a modest fixed cutoff, only 10Fold cross validation with accuracy as the choice of metric, in the multi-class BVN dataset showed a reduction of 66% in running time without a reduction in performance on both the training and validation sets. The adaptiveCV approach however did not prove to be beneficial in the remaining experiments, either due to a small reduction (less than 30 %) in running time or poorer performance on the cross-validation or validation data.
At the crux of this approach lies the ability to choose a threshold accurately, that can weed out poor performers quickly and retain the promising HCs. The optimal threshold values tend to vary for different experiment settings. This requires running these experiments multiple times to determine a good cutoff value which negates the time gain from the approach. A potential future research direction would be to set a variable threshold that updates itself based on the values of the previous iterations. With such a variable threshold, perhaps more time could be saved without a compromise on the performance.
Conclusion
We did not find an advantage in using the adaptive CV approach. The concept appears intuitively appealing at first, but our experiments to date do not support it.
References
- Tsamardinos, I., Greasidou, E. and Borboudakis, G., 2018. Bootstrapping the out-of-sample predictions for efficient and accurate cross-validation. Machine Learning, 107(12), pp.1895-1922.
- Swersky, K., Snoek, J., & Adams, R. P. (2013). Multi-task bayesian optimization.
- Zheng, A.X. and Bilenko, M., 2013, June. Lazy paired hyper-parameter tuning. InTwenty-Third International Joint Conference on Artificial Intelligence.
- Li, L., Jamieson, K., DeSalvo, G., Rostamizadeh, A. and Talwalkar, A., 2017. Hyperband: A novel bandit-based approach to hyperparameter optimization. The Journal of Machine Learning Research, 18(1), pp.6765-6816.