Adaptive CV: An approach for faster cross validation and hyperparameter tuning
By Nandita Damaraju, Inflammatix, Inc.
Introduction
Identification of optimal hyperparameters is an integral component for building robust accurate machine learning models. Hyperparameters control various aspects of a classification model such as learning rate, regularization, and model architecture. These hyperparameters influence the time required to train the model and ultimately its performance. Simpler methods such as logistic regression tend to have fewer hyperparameters to tune compared to advanced methods like deep neural networks. As the models become more complex, the possible space of hyperparameter configurations (HCs) increases exponentially and evaluating hyperparameters becomes computationally intensive.
Traditional methods for sifting through the many possible HCs include Grid Search and Random Search. However, these approaches suffer when evaluating models with many hyperparameters as the search space becomes exponentially larger. Methods such as Bayesian Optimization and Hyperband, use relatively lesser computational resources to achieve a comparable result.
A commonly used approach to identify the best performing HC is estimating performance of a model trained using the HC by k-fold cross validation The k-fold cross-validation procedure divides a limited dataset into k non-overlapping parts. Each of the k parts is used as a held back validation set whilst all other parts are collectively used for training. A total of k models are fit and evaluated on the k holdout test sets and average performance metrics are reported. This concept is also used to assess the performance of the HCs by training models with different hyperparameters and evaluating them. However, k-fold cross validation further increases the computational complexity of the problem as it requires a model to be trained and tested k times for each HC.
In this blog, we aim to further reduce the time to identify a top performing HC by truncating cross validation runs that do not show promise. For some HCs, the performance metric tends to be low for most folds in a cross validation run. It is unlikely that these HCs would be top contenders. For such HCs, it would not make sense to train models for later folds if the performance is poor in the first few folds. For example, let’s say a 5-fold CV is used to iterate through HCs for a Multi-Layer Perceptron (MLP). It is possible that the first fold for a particular HC, results in a very low AUC value of 0.6. The AUC values of the next 4 folds wouldn’t be able to compensate for the low AUC value of 0.6 in the first fold, thus unlikely to remain a top contender. Hence it would be a waste of computational time to compute the AUC values for the remaining 4 folds.
If the computation of poor performing HCs is truncated, computational resources can be spent on more promising HCs and the time to iterate through the hyperparameter space will be reduced. This could be useful in cases where there is a high proportion of poor performing HCs or if the algorithm takes a significant amount of time to iterate through each HC.
Data
At Inflammatix, we use gene expression data to build classifiers to diagnose various infectious diseases. In this context, each input sample (vector) represents one person (patient), features correspond to genes, and the classes correspond to different diseases or disease states. Each feature value is a measurement of the abundance of the corresponding gene in a given tissue type (e.g., blood sample), using a suitable measurement platform such as qPCR. The task is to classify the patient’s disease accurately using the gene measurements as input features.
We used two datasets for this blog post (see table below). We used the samples in the training set with cross validation to identify top performing models. For both studies, we used the separate held-out validation set to evaluate these models and create the final model.
| Dataset | #Features | #Classes | #Training Samples | #Validation Samples |
| BVN | 29 | 3 | 3159 | 741 |
| Severity | 29 | 2 | 2622 | 1060 |
Approach
The modified cross validation approach is described as follows (see Figure 1) :
- Establish a performance threshold for the algorithm, for example an AUC of 0.7
- For each HC
- Compute the chosen metric for the first fold
- If the metric is above the threshold, proceed to the next fold
- If the metric is below the threshold, do not compute the metrics for the remaining folds and skip to next HC
- Continue this process, either until the value for a fold is below the threshold or until all folds are completed.
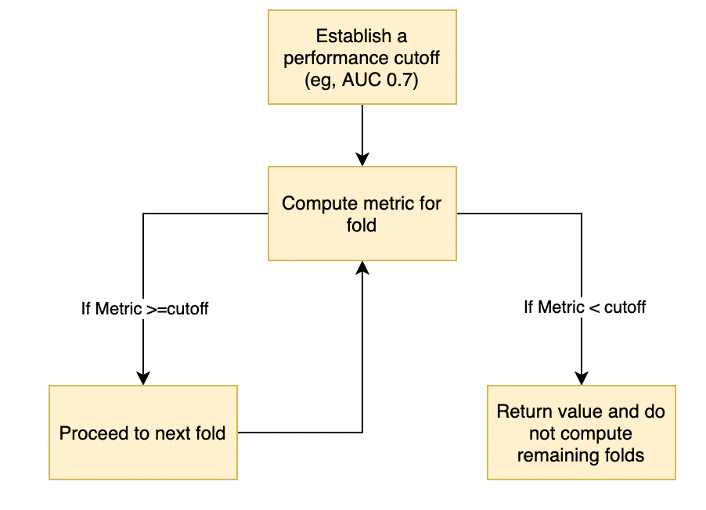
Figure 1: Flowchart to describe the adaptive CV approach
This would result in one single best performing hyperparameter configuration based on the cross-validation performance for a given method. The performance of the top performing HC for different methods are then evaluated on a separate held-out validation set.
Identifying good candidates
How do we identify scenarios where this approach could result in a significant reduction in training time?
We plotted the pooled cross validation AUC values (X-axis) against the fraction of AUCs that are below these values (Y-axis) for 4 different algorithms RBF, MLP, LOGR and XGBoost (see Figure 2). An ideal candidate would have (1) a significant proportion of HCs below a cutoff threshold, and (2) a gradual increase in AUC values as opposed to a sharp rise as a sharp rise would make it harder to select a robust threshold value.
MLPs had over 60% of HCs below an AUC of 0.75. XGBoost on the other hand demonstrated a sharp rise and a narrow range of AUC values (see Figure 2), making it hard to determine a suitable cutoff and hence making XGB unsuitable for this approach. LOGR and RBF also had only ~20% of their values below 0.75, hence making it harder to justify the usage of these algorithms for less than a 20% reduction in time. Therefore, we chose MLPs to test the efficacy of this approach.
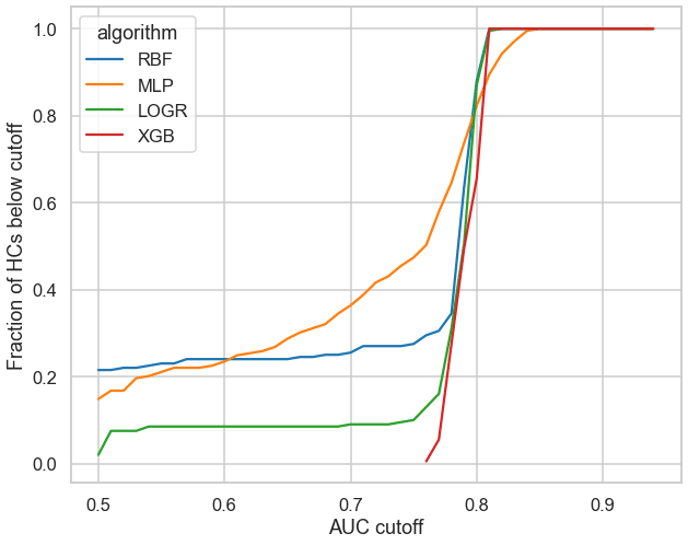
Figure 2: Fraction of HCs (y-axis) above threshold values (x-axis)
Experimental Setup
We used MLPs with both 5 and 10-fold cross validation experiments. We tuned hyperparameters using Hyperband with either AUC or accuracy as the performance metric. We compared the running time, Cross Validation (CV) performance and the held-out-validation data (Validation) performance for various thresholds.
Results
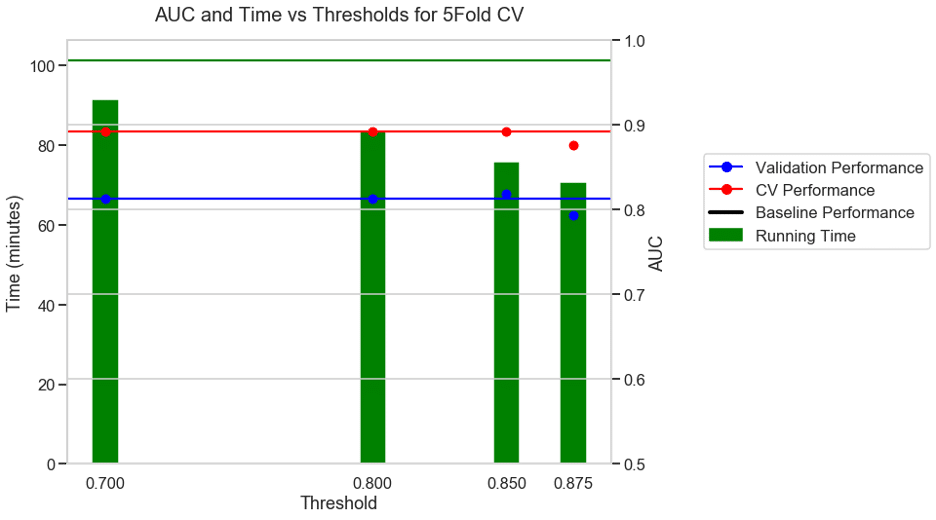
The following plots depict four experiments. We evaluated the running time, cross validation (CV) performance, and the held-out-validation data (Validation) performance for different threshold values as shown on the x-axis.
The green bars represent the corresponding running time on the y axis on the left. The distance between a green bar and the horizontal green baseline performance value denotes the reduction in running time for a particular threshold. The lower the height of the green bars, the higher the reduction in running time.
The y-axis on the right indicates the performance, with validation in blue and CV performance in red. The green blue and red horizontal lines illustrate the baseline (without any threshold) running time, validation, and CV performance. Ideally, we would want the dots to be very close to their respective baseline values represented by the horizontal lines since we do not want to see a reduction in performance.
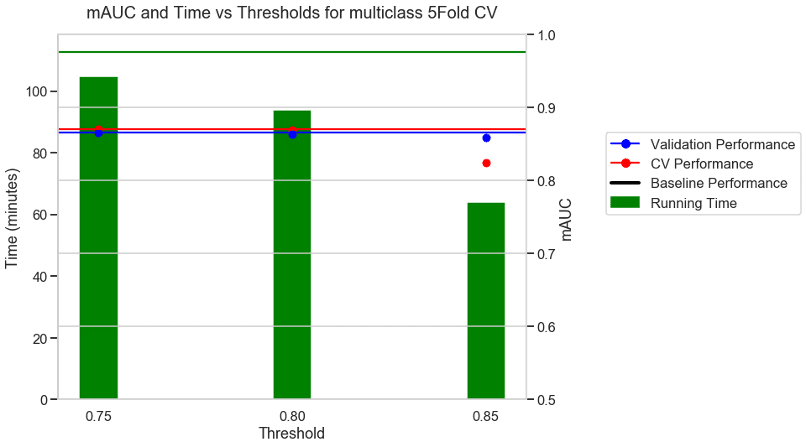
Experiment 1: 5FOLD CV + mAUC as metric + BVN multi class dataset
The first experiment used the multi-class BVN dataset and a 5-fold CV with AUC as the performance metric. With no threshold the baseline took 112 minutes to run as shown by the green horizontal line. With a moderate threshold of about 0.75 there was a 9% reduction in running time and similar performance to the baseline. With a stricter threshold of 0.8, there was a 17% reduction in running time and a similar performance to the baseline. With a very aggressive threshold of 0.85 there was a 43% reduction in running time and a reduction in the CV performance, but no reduction in the validation performance.
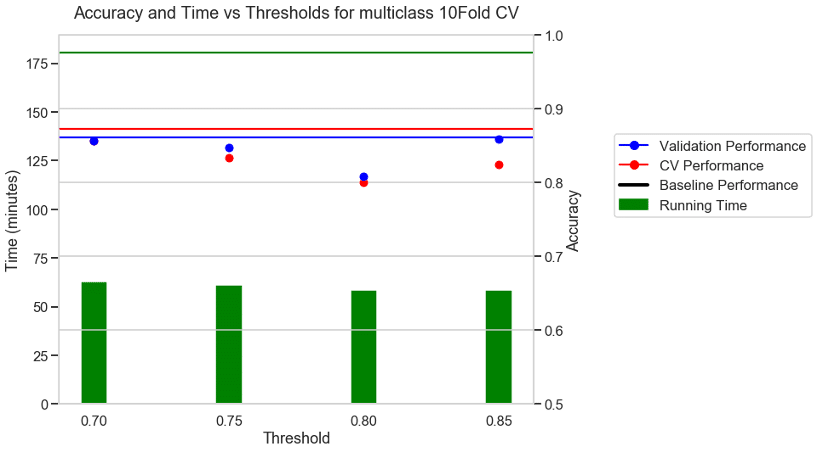
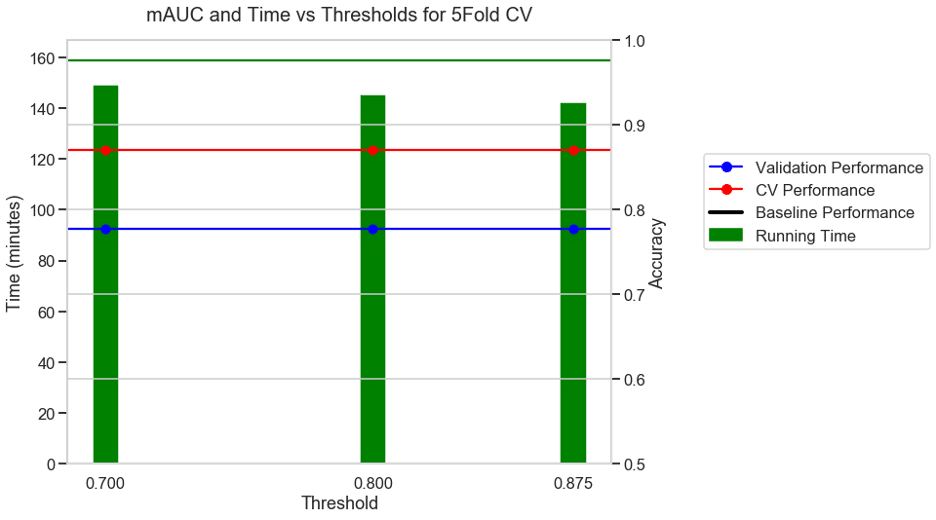
Experiment 2: 10 FOLD CV + Accuracy as metric + BVN multi class dataset
For a 10-fold CV some of the folds did not have all the classes present. In those cases, AUC is not defined and hence we chose accuracy as the metric for 10-Fold CV. The baseline with no threshold took 180 minutes to run. With a moderate threshold of about 0.7 there was a 66% reduction in running time and a small reduction in CV performance. With a stricter threshold of 0.8 and 0.85 there was a 70% reduction in running time, but a higher reduction in the performance values.
Experiment 3: 5 FOLD CV + AUC as metric + S3 binary classification dataset
For a binary classification dataset (S3) the run time without a threshold was 101 minutes. With a moderate threshold of 0.7, there was a 10% reduction in running time and with an aggressive threshold of 0.875 there was a 31% reduction in running time with a modest drop in performance.
Experiment 4: 10 FOLD CV + Accuracy as metric + S3 binary classification dataset
For the same binary classification dataset, with a 10-fold CV and accuracy as the choice of metric, the baseline took 158 minutes. With a moderate threshold of 0.7, there was a 5% reduction in running time and with an aggressive threshold of 0.875 there was a 10% reduction in running time and no reduction in performance.
Discussion
With a modest fixed cutoff, only 10Fold cross validation with accuracy as the choice of metric, in the multi-class BVN dataset showed a reduction of 66% in running time without a reduction in performance on both the training and validation sets. The adaptiveCV approach however did not prove to be beneficial in the remaining experiments, either due to a small reduction (less than 30 %) in running time or poorer performance on the cross-validation or validation data.
At the crux of this approach lies the ability to choose a threshold accurately, that can weed out poor performers quickly and retain the promising HCs. The optimal threshold values tend to vary for different experiment settings. This requires running these experiments multiple times to determine a good cutoff value which negates the time gain from the approach. A potential future research direction would be to set a variable threshold that updates itself based on the values of the previous iterations. With such a variable threshold, perhaps more time could be saved without a compromise on the performance.
Conclusion
We did not find an advantage in using the adaptive CV approach. The concept appears intuitively appealing at first, but our experiments to date do not support it.
References
- Tsamardinos, I., Greasidou, E. and Borboudakis, G., 2018. Bootstrapping the out-of-sample predictions for efficient and accurate cross-validation. Machine Learning, 107(12), pp.1895-1922.
- Swersky, K., Snoek, J., & Adams, R. P. (2013). Multi-task bayesian optimization.
- Zheng, A.X. and Bilenko, M., 2013, June. Lazy paired hyper-parameter tuning. InTwenty-Third International Joint Conference on Artificial Intelligence.
- Li, L., Jamieson, K., DeSalvo, G., Rostamizadeh, A. and Talwalkar, A., 2017. Hyperband: A novel bandit-based approach to hyperparameter optimization. The Journal of Machine Learning Research, 18(1), pp.6765-6816.